
How Learnable Is BTC Fair-Market Value from HLCOV?
A disciplined attempt to predict Bitcoin's next-minute fair value from price and volume alone, and an honest account of the wall it hits.
In brief
A commissioned probe into whether Bitcoin's minute-by-minute fair value can be forecast from raw HLCOV, run as a reproducible, laptop-scale experiment rather than a trading system. The result is a clean negative under the honest metric — directional accuracy hovers at chance — and the project's real contribution is the discipline it brings to measuring that honestly, refusing the comforting near-perfect R² that autocorrelation hands out for free.
Key results
- Across all v1 models — naive, ridge, lasso, random forest, HistGradientBoosting, MLP, and LSTM — next-bar directional accuracy came in at approximately 0.5, indistinguishable from a coin flip.
- Price-level R2 is dominated by autocorrelation: the naive 'next price = current price' baseline scores near 0.999, so R2 does not measure learnability and the study compares on MAE, RMSE, and directional accuracy instead.
- The feature set spans current HLCOV plus N lagged HLCOV bars (default lookback 20) plus derived returns, range, volume ratio, and return-volatility — evaluated on a chronological split with the last 20% held out and no shuffle, and no lookahead leak.
- v2 widens the inputs roughly tenfold to about 89 quantitative features, including Parkinson, Garman-Klass, Rogers-Satchell and Yang-Zhang volatility, RSI/MACD/Stochastic oscillators, and microstructure signals like taker-buy ratio, Kyle's lambda, and VPIN.
- v2 sweeps seven FMV target definitions — close, typical, VWAP, (H+L)/2, open-close midpoint, geometric mean, and a five-bar-ahead mean — and adds a 1D CNN and a 2-layer, 4-head, d=64 Transformer alongside the LSTM.
- The default run trains on up to 300k rows in under about five minutes on a laptop, deliberately kept light and CPU-friendly rather than scaled up.
The Learnability Question
The premise is deliberately narrow. Rather than asking whether Bitcoin can be traded profitably, the study asks whether the next minute's fair-market value carries any predictable signal in the most basic data a market emits: the high, low, close, open, and volume of each one-minute bar. Fair-market value is pinned to a concrete target — the next bar's typical price, (H+L+C)/3 — with an option to swap in the next-bar close instead.
The point of framing it as learnability is to strip away the machinery of a trading system and isolate one measurable thing. If a graded set of models, from a linear baseline up to a sequence network, cannot extract a signal from HLCOV, then over this feature set learnability is effectively zero. The experiment is built to give that answer cleanly rather than to flatter any particular method.
Data and Method
The data is BTCUSDT one-minute klines pulled from Binance's public dump at data.binance.vision, which serves the same shape of one-minute history as the originally requested Kaggle dataset but without any authentication or rate limits. The default fetch is the six most recent complete months, with each monthly tarball around ten megabytes compressed.
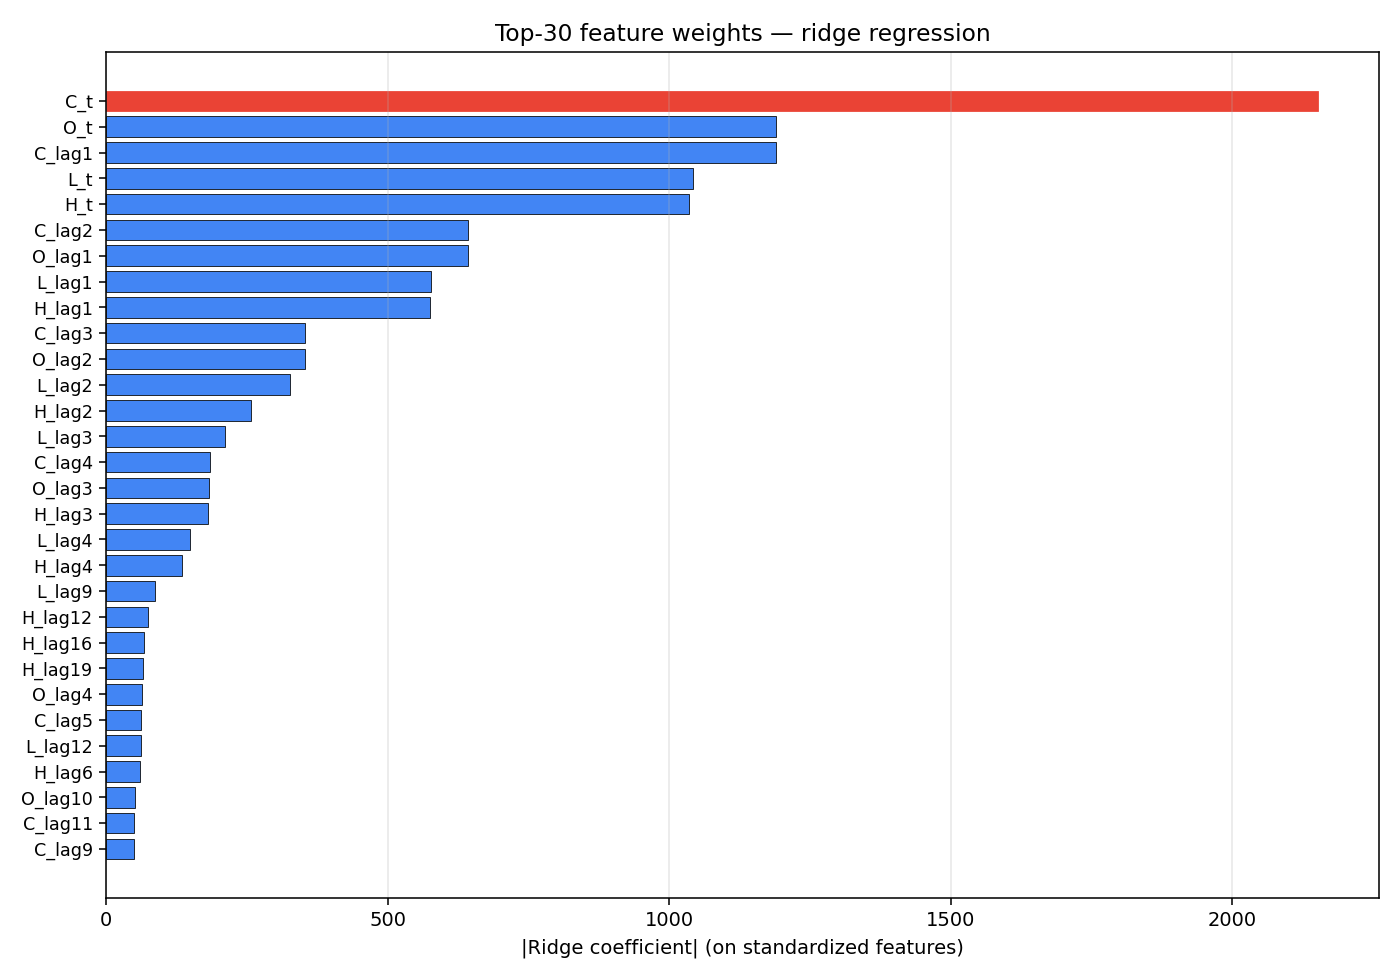
Features are the current bar's HLCOV, the last N lagged HLCOV bars (default lookback of 20), and a handful of standard derived signals: returns over the lookback window, range, a volume ratio, and return-volatility. The models form a ladder chosen to answer distinct questions — naive baselines to set the bar, ridge and lasso to test whether a linear signal exists, random forest and HistGradientBoosting to catch tree-friendly non-linearities, an MLP to confirm the gradient-boosted models are not underfitting, and a PyTorch sequence-to-one LSTM to test whether the raw ordering of the five-channel time series carries information the engineered features miss.
Evaluation uses a strict chronological train/test split: the final 20% of the window is held out with no shuffling, and features at bar t only ever use bars up to t while the target is bar t+1, so there is no lookahead leak.
The R-Squared Trap
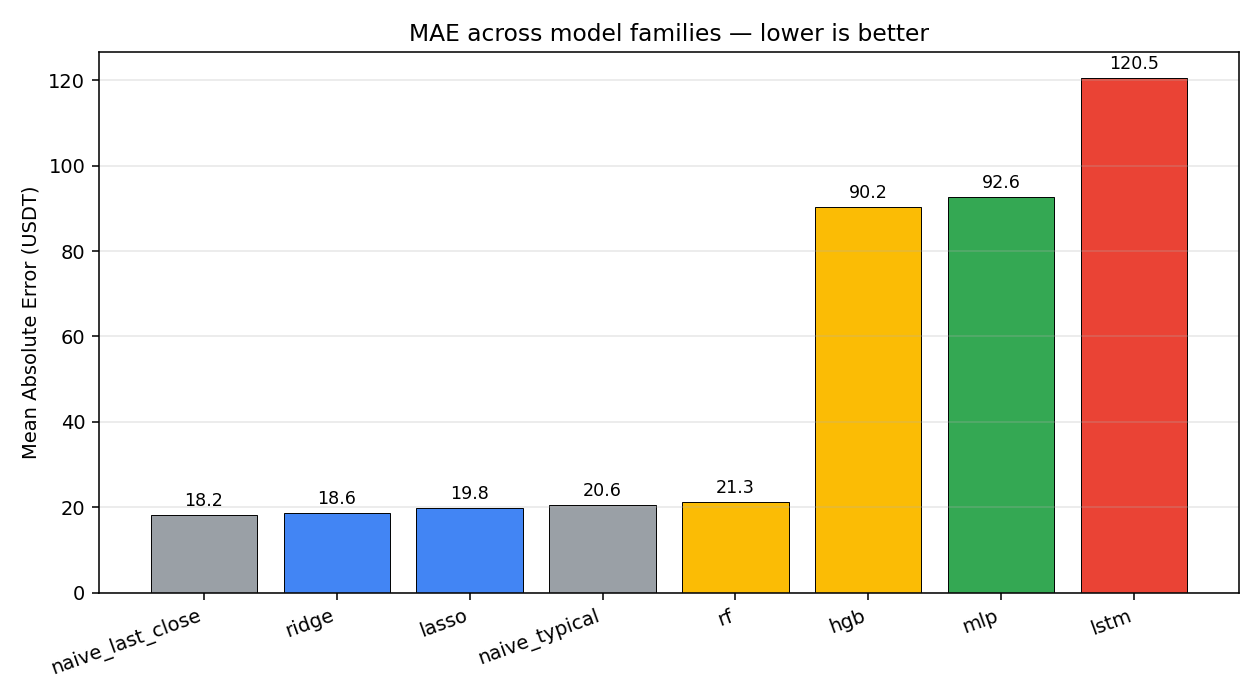
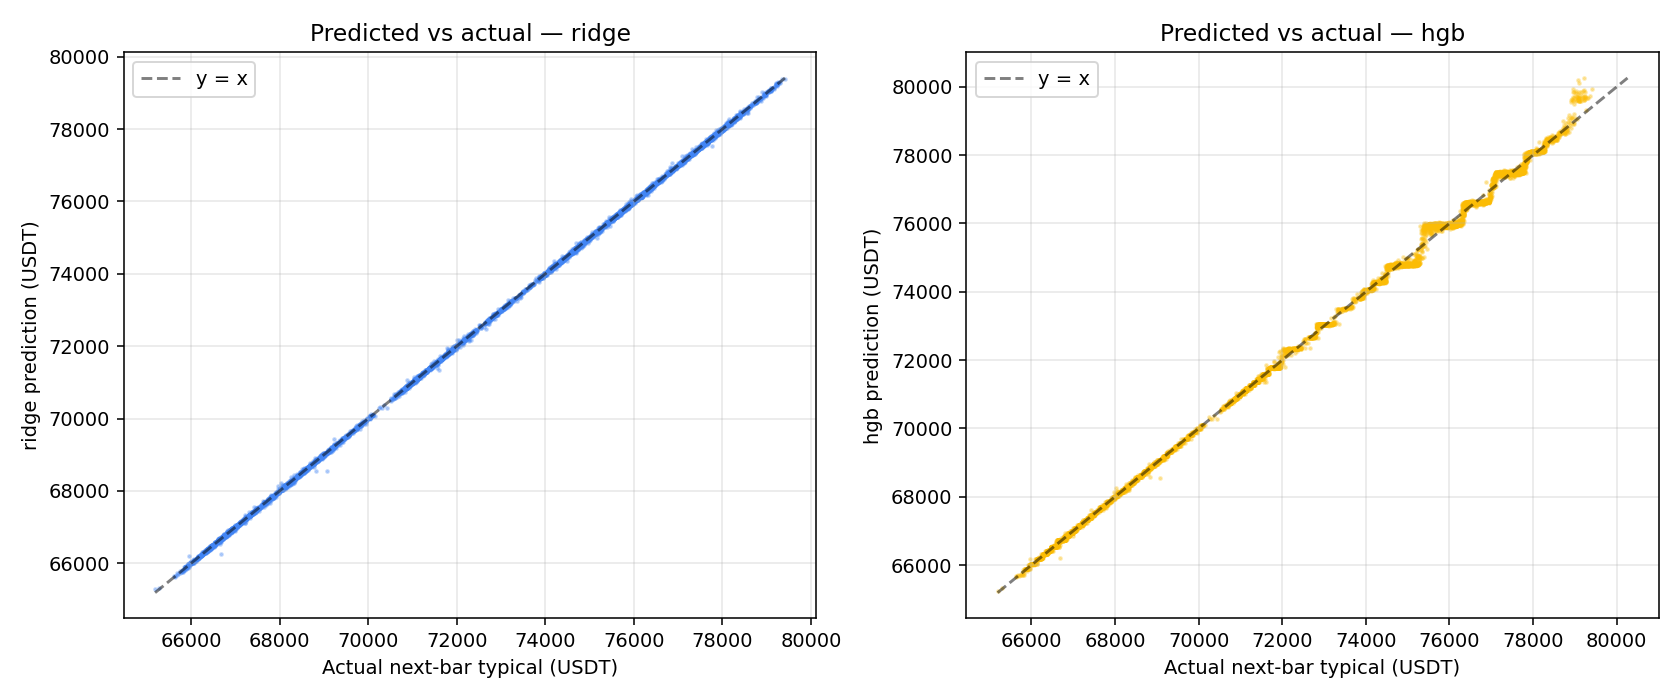
The most important measurement decision in the study is what not to trust. On the price level, R² is inflated by autocorrelation to the point of meaninglessness — a model that simply predicts the next price equals the current price scores around 0.999. A near-perfect R² here says nothing about whether anything was learned; it merely restates that adjacent minute prices are close together.
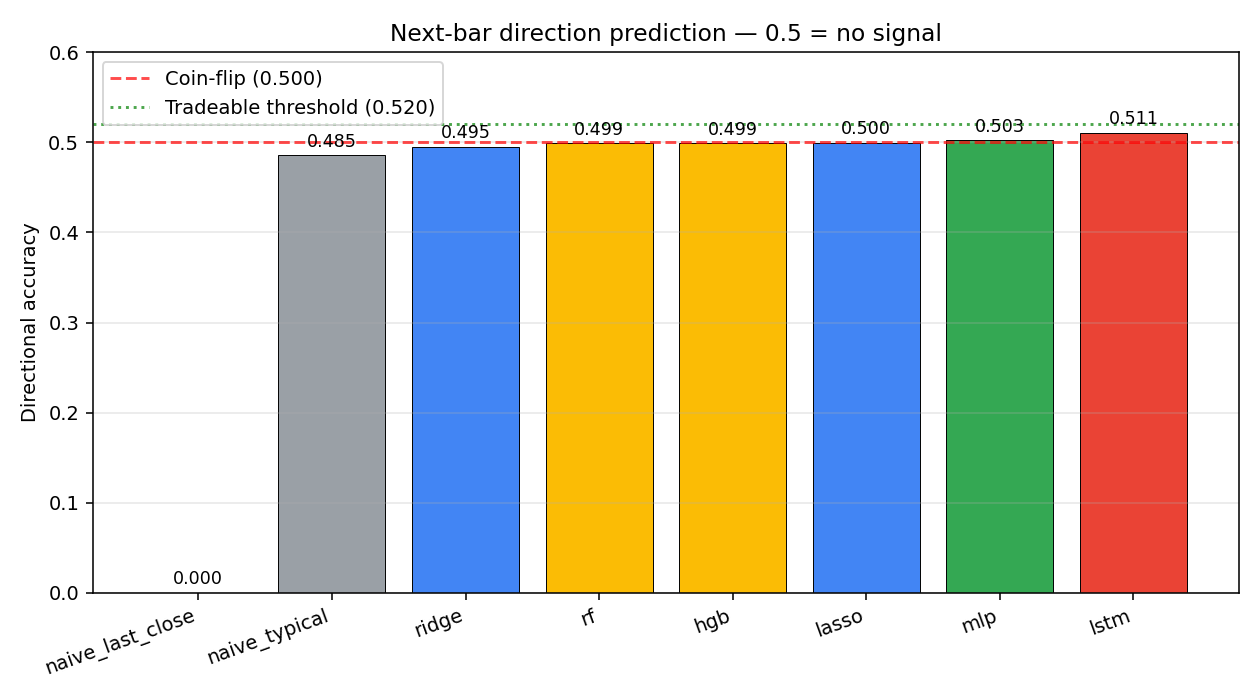
For that reason the study elevates directional accuracy — the sign of the next-bar return — as the metric that actually measures learnability, with MAE and RMSE alongside it. Getting the direction right is the part that requires real signal; getting the level approximately right is nearly free.
The v1 Result
The answer from version 1 is a flat one. Across every model in the ladder — naive, ridge, lasso, random forest, HistGradientBoosting, MLP, and LSTM — next-bar directional accuracy came in at roughly 0.5. No family beat the coin flip, and nothing beat the naive baseline on the metric that matters.
That uniformity is itself informative. When linear models, tree ensembles, a dense net, and a sequence model all land at chance, the shortfall is unlikely to be an underfitting artifact of any one method. Over this feature set and horizon, the signal simply is not there to be found.
Widening the Net (v2)
Rather than declaring the question closed, version 2 responds to the flat v1 result by attacking both halves of the setup. The feature library expands roughly tenfold to about 89 quantitative features: realized-volatility estimators (Parkinson, Garman-Klass, Rogers-Satchell, Yang-Zhang), oscillators (RSI, MACD, Williams %R, Stochastic, CCI), trend and band indicators (ADX, Aroon, ROC, Bollinger, Donchian, Keltner), volume and microstructure signals (OBV slope, Chaikin money flow, MFI, Amihud illiquidity, Roll spread, VWAP deviation, taker-buy ratio, Kyle's lambda, VPIN), statistical descriptors (Hurst exponent, variance ratio, autocorrelations at lags 1 and 5, skewness, kurtosis, approximate entropy), and quant ratios (rolling Sharpe, Sortino, Kelly, max drawdown, Calmar, Ulcer), aggregated across 5-, 15-, and 60-minute scales.
The definition of fair value is also revisited rather than assumed. Version 2 sweeps seven FMV targets — close, typical, VWAP, the (H+L)/2 midpoint, the open-close midpoint, the geometric mean, and a five-bar-ahead mean as a longer-horizon target. Two deep models join the LSTM: a 1D CNN and a small Transformer encoder (two layers, four heads, d=64) over the lookback feature sequence. Permutation feature importance on the HistGradientBoosting model is used to see which of the many features actually move the held-out error. Outputs land in a separate results_v2 directory.
Scope and Limits
The project is scrupulous about its own boundaries. No fees, slippage, or spread are modelled, so a directional accuracy near 0.51 on an average move of a few basis points would not be tradeable even if it were real. The evaluation runs over a single contiguous window rather than walking forward across distinct regimes such as choppy 2022 versus the 2024 bull, which is what a genuine backtest would require. This is explicitly a learnability check, not a trading strategy.
The engineering matches that modest scope: the whole run is designed to finish in roughly five minutes on a laptop, training on up to 300k rows, niced down so it does not pin the CPU. The value on offer is not a model to deploy but a clean, reproducible, leak-free answer to a specific question — and an example of measuring the answer with the metric that cannot be gamed by autocorrelation.
Abstract
This study asks a single question: how learnable is next-bar fair-market value (FMV) for Bitcoin from HLCOV alone — the high, low, close, open, and volume of one-minute bars? Using BTCUSDT 1-minute klines from Binance's public dump, it defines FMV as the next bar's typical price (H+L+C)/3 and fits a graded ladder of models — naive baselines, ridge and lasso, random forest, sklearn HistGradientBoosting, an MLP, and a PyTorch sequence-to-one LSTM — on current plus lagged HLCOV and a few standard derived signals. Evaluation is a strict chronological split with the last 20% held out and no shuffling, scored on MAE, RMSE, R², and directional accuracy (the sign of the next-bar return). The central methodological point is that R² on the price level is inflated by autocorrelation — even a "next price = current price" baseline lands near 0.999 R² — so directional accuracy is the metric that actually measures learnability. Version 1 returned roughly 0.5 directional accuracy across every model, no better than a coin flip. Version 2 expands the feature set roughly tenfold to about 89 quantitative features (realized-volatility estimators, oscillators, trend and band indicators, volume and microstructure signals, statistical descriptors, and quant ratios across multiple time scales), sweeps multiple FMV target definitions including VWAP and a five-bar-ahead mean, and adds 1D-CNN and small-Transformer deep models. The work is framed explicitly as a learnability check, not a backtest: no fees, slippage, or spread are modelled, and it runs over a single contiguous window.
More figures
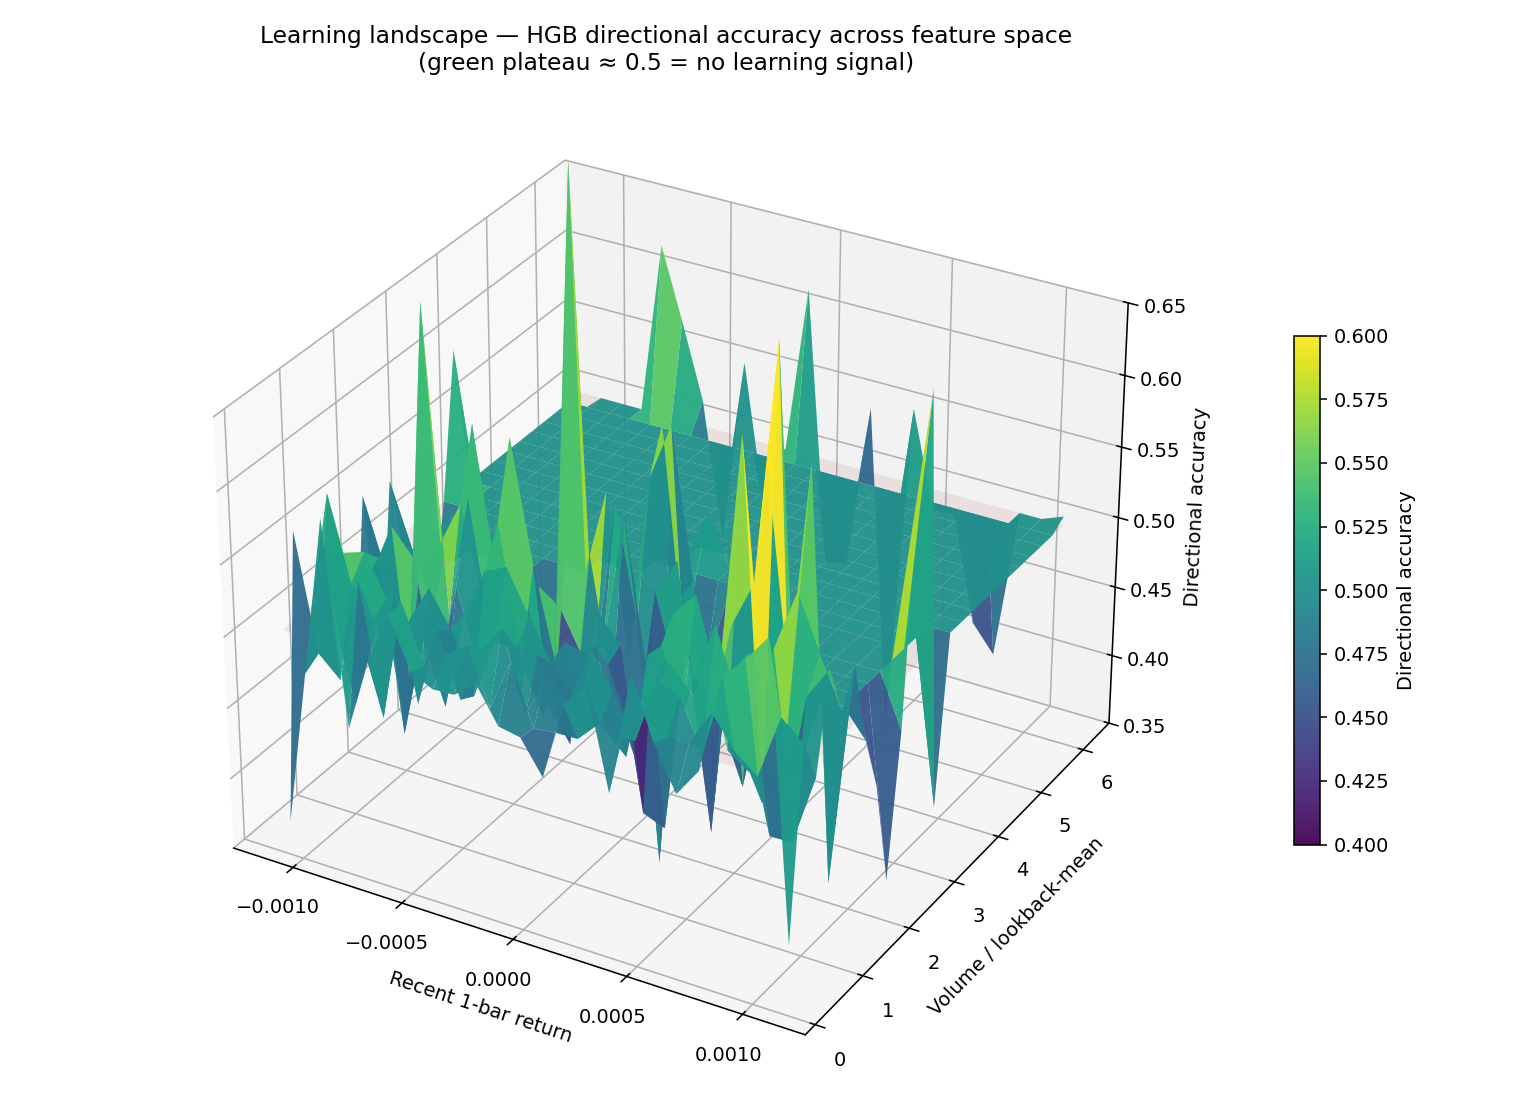
Fig. 1The learning landscape across models and settings, visualizing where — if anywhere — error improves over the naive baseline. 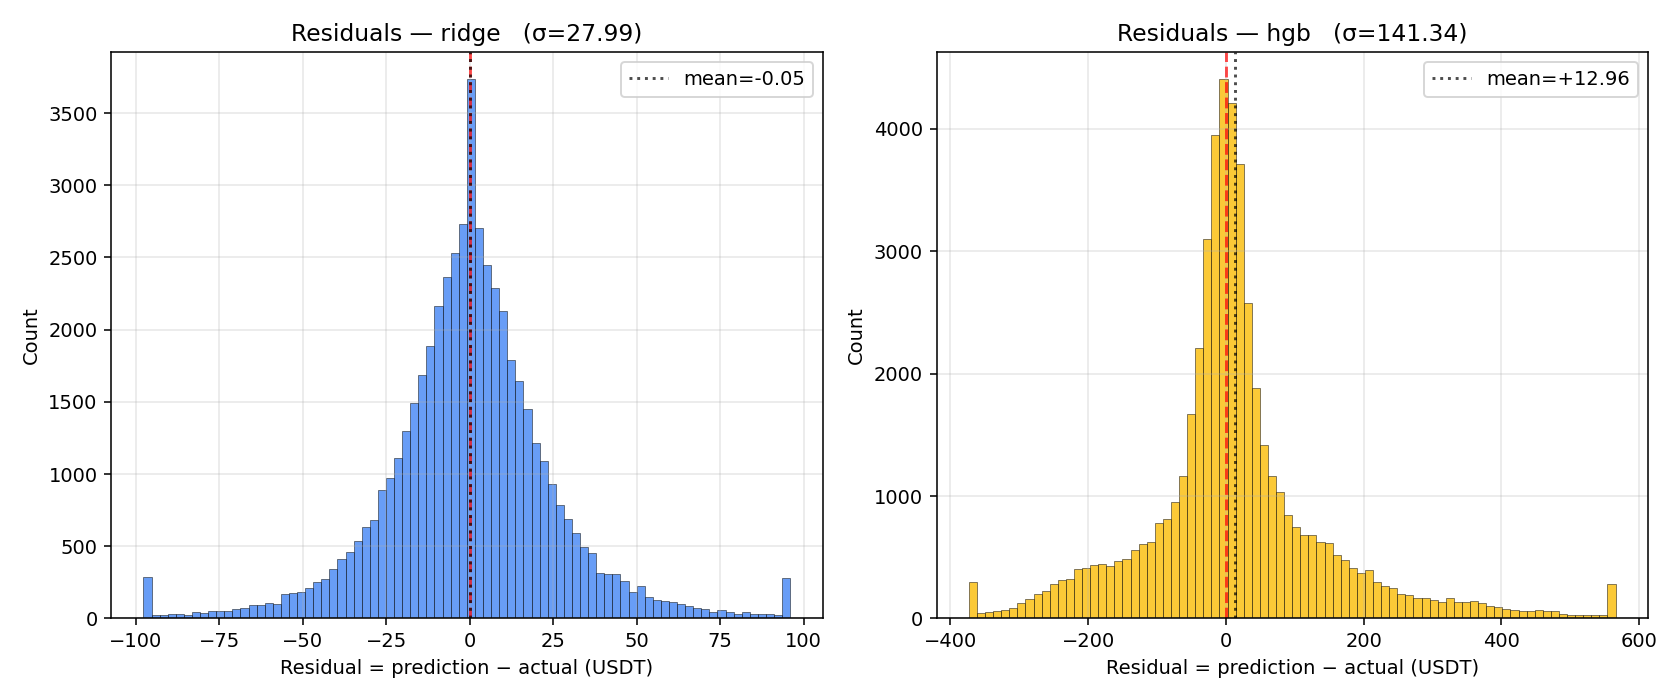
Fig. 2Residuals from the v1 models, showing the error structure left after fitting on HLCOV and its lags.