
Chasing the Small-Frontier on a Fixed Rig
A measurement-driven account of training a small language model to frontier quality on two fixed GPUs — with adversarial self-audit of the lab's own instruments.
In brief
Chasing the Small-Frontier documents pushing a small language model toward frontier quality on two fixed GPUs — and, more importantly, adversarially auditing the lab's own evaluation harness. The audit recovered more real signal than more training would have, and the paper closes with the first benchmark-contamination measurement of its kind in the small-model literature.
Key results
- Rebuilt byte-normalized scorer: reference leads argmax accuracy by 0.028 (95% CI [+0.002,+0.055]), yet our model leads the smooth log-likelihood margin +0.188 to +0.141.
- The reference (135M) saw ~2x10^12 tokens versus our 1.97x10^9 - a ~1017x data-scale gap, at ~15,000 tokens per parameter against our 12.4, so the deficit is scale as much as skill.
- An apparent 3.0x learning-rate advantage shrinks to 1.16x (p=0.067) once the class-prior benchmark BoolQ is deleted; bits-per-byte favors the old default.
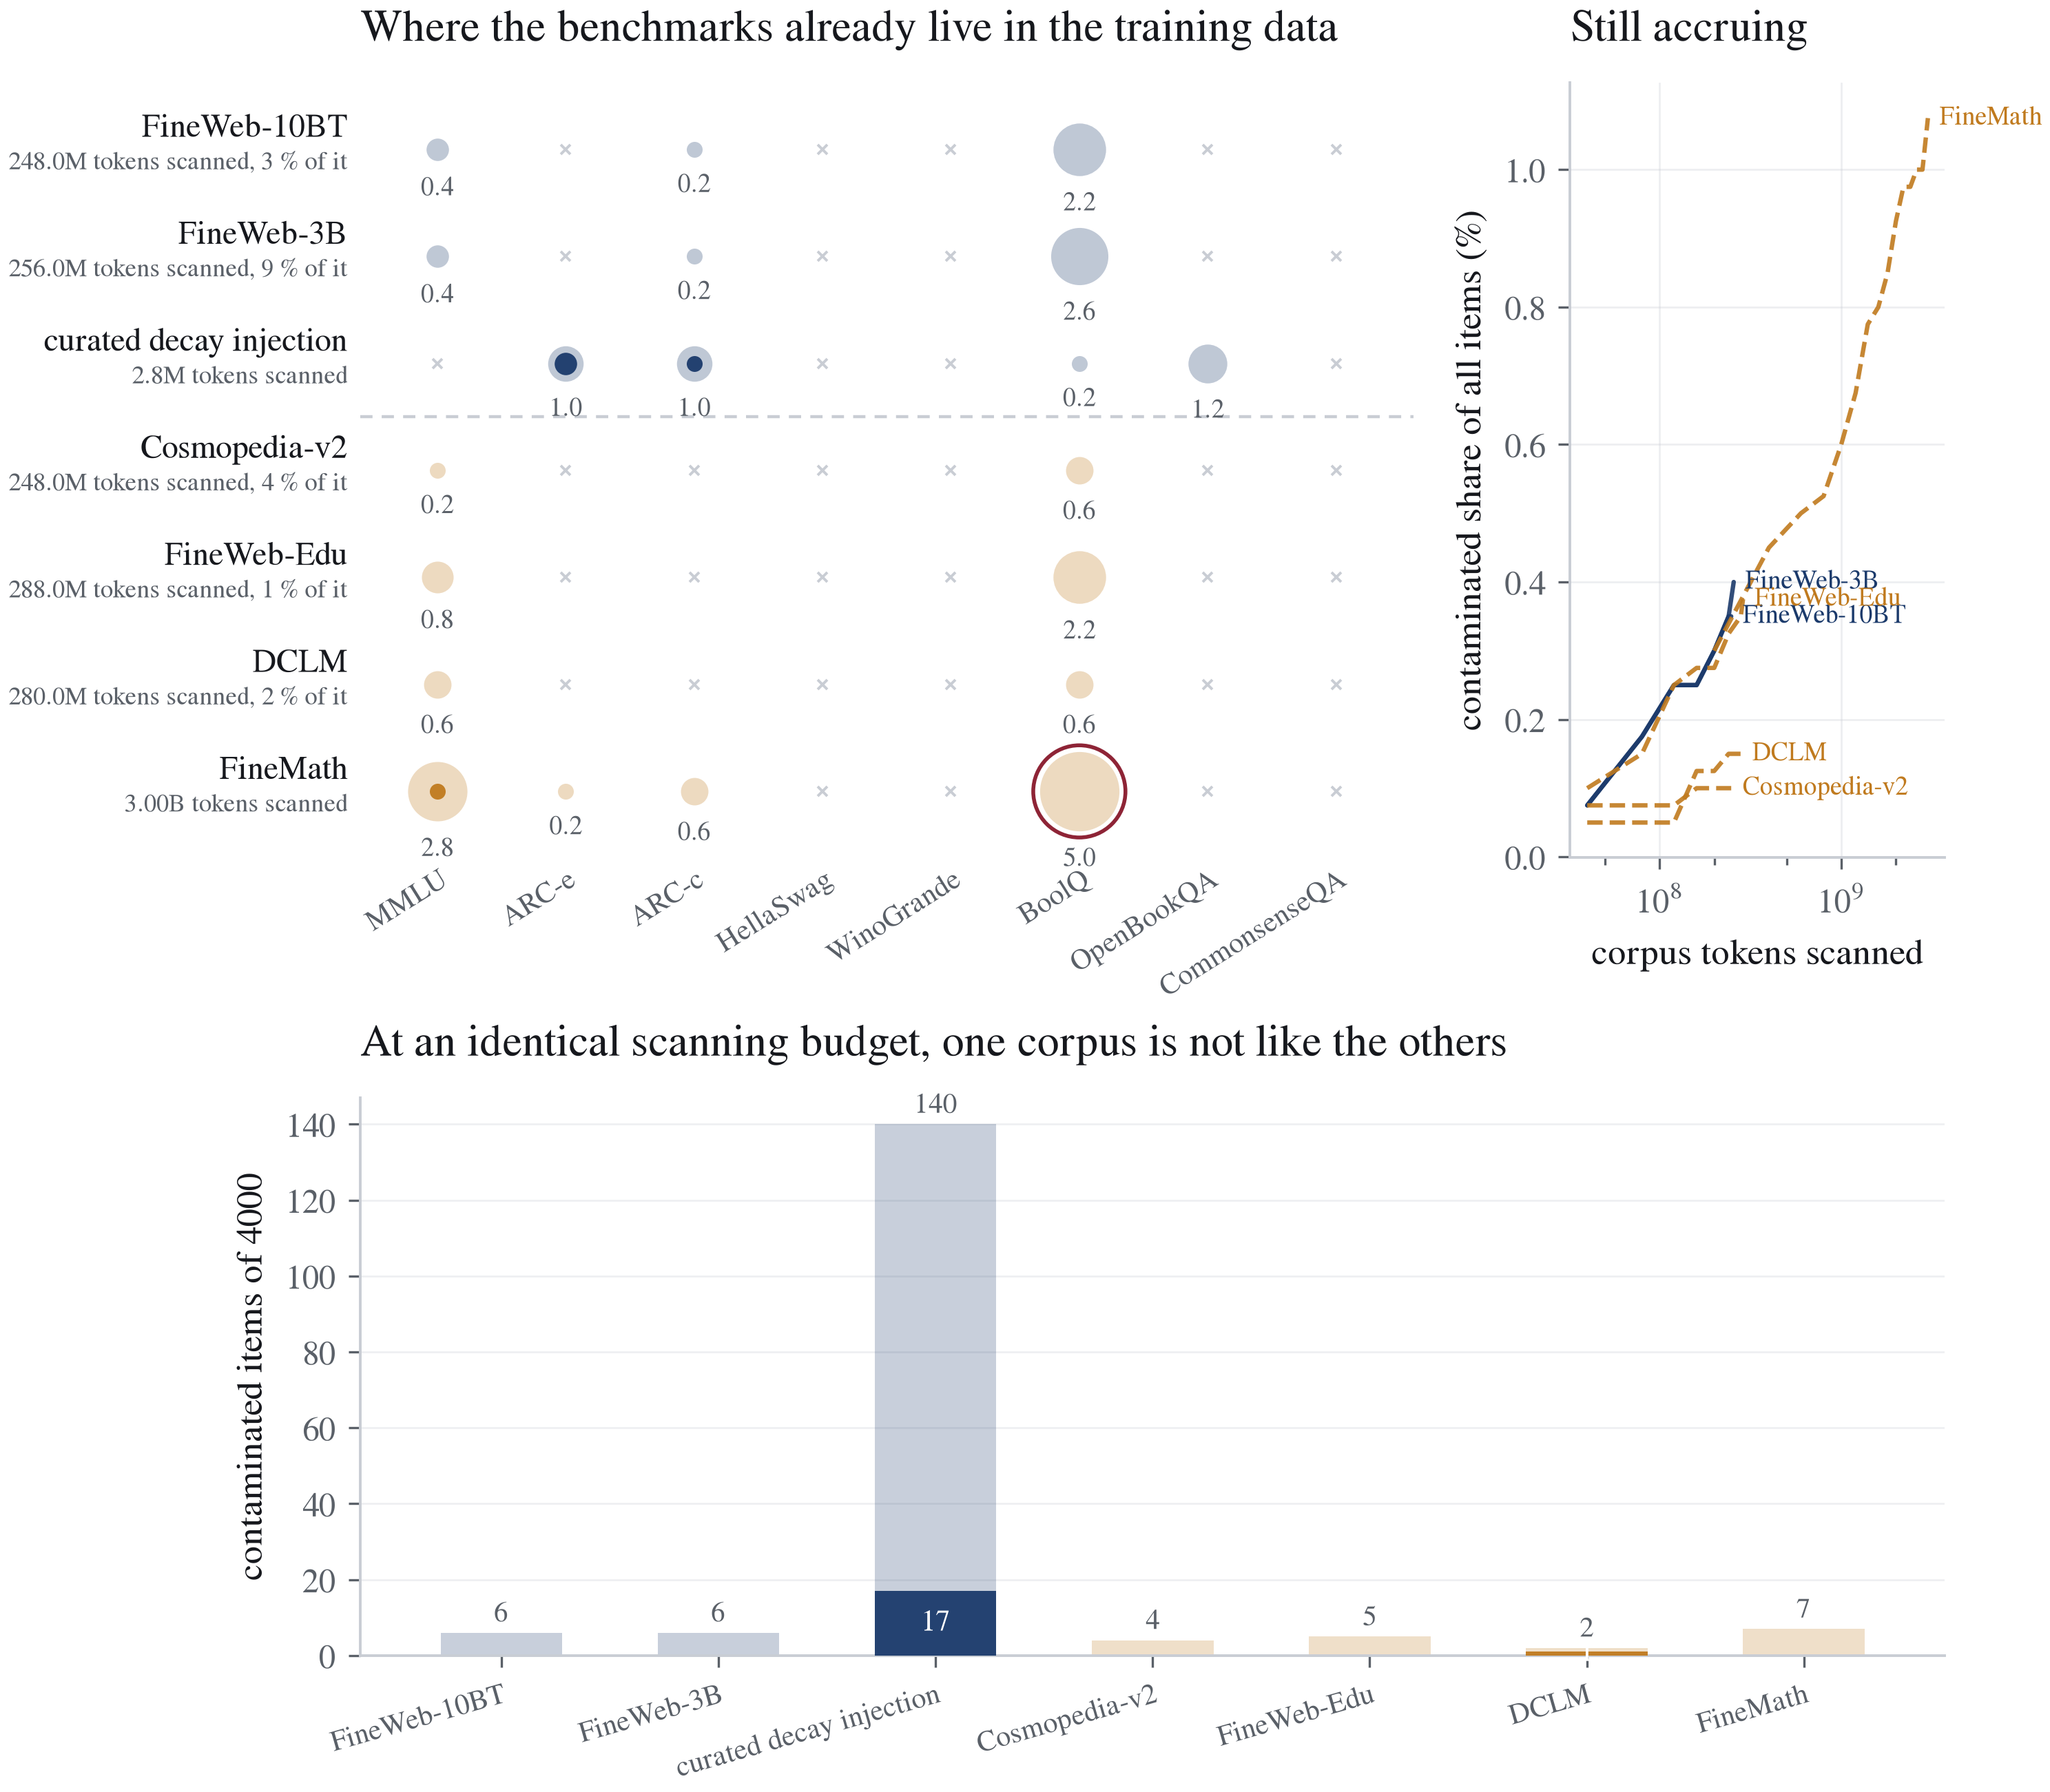
- Contamination concentrates in the hand-curated annealing buffer: 17 of 4000 eval items with verbatim 13-grams versus 0-1 for every web corpus.
- Scanned to completion, the reference's own FineMath corpus hits 5.0% contamination on BoolQ and 2.8% on MMLU.
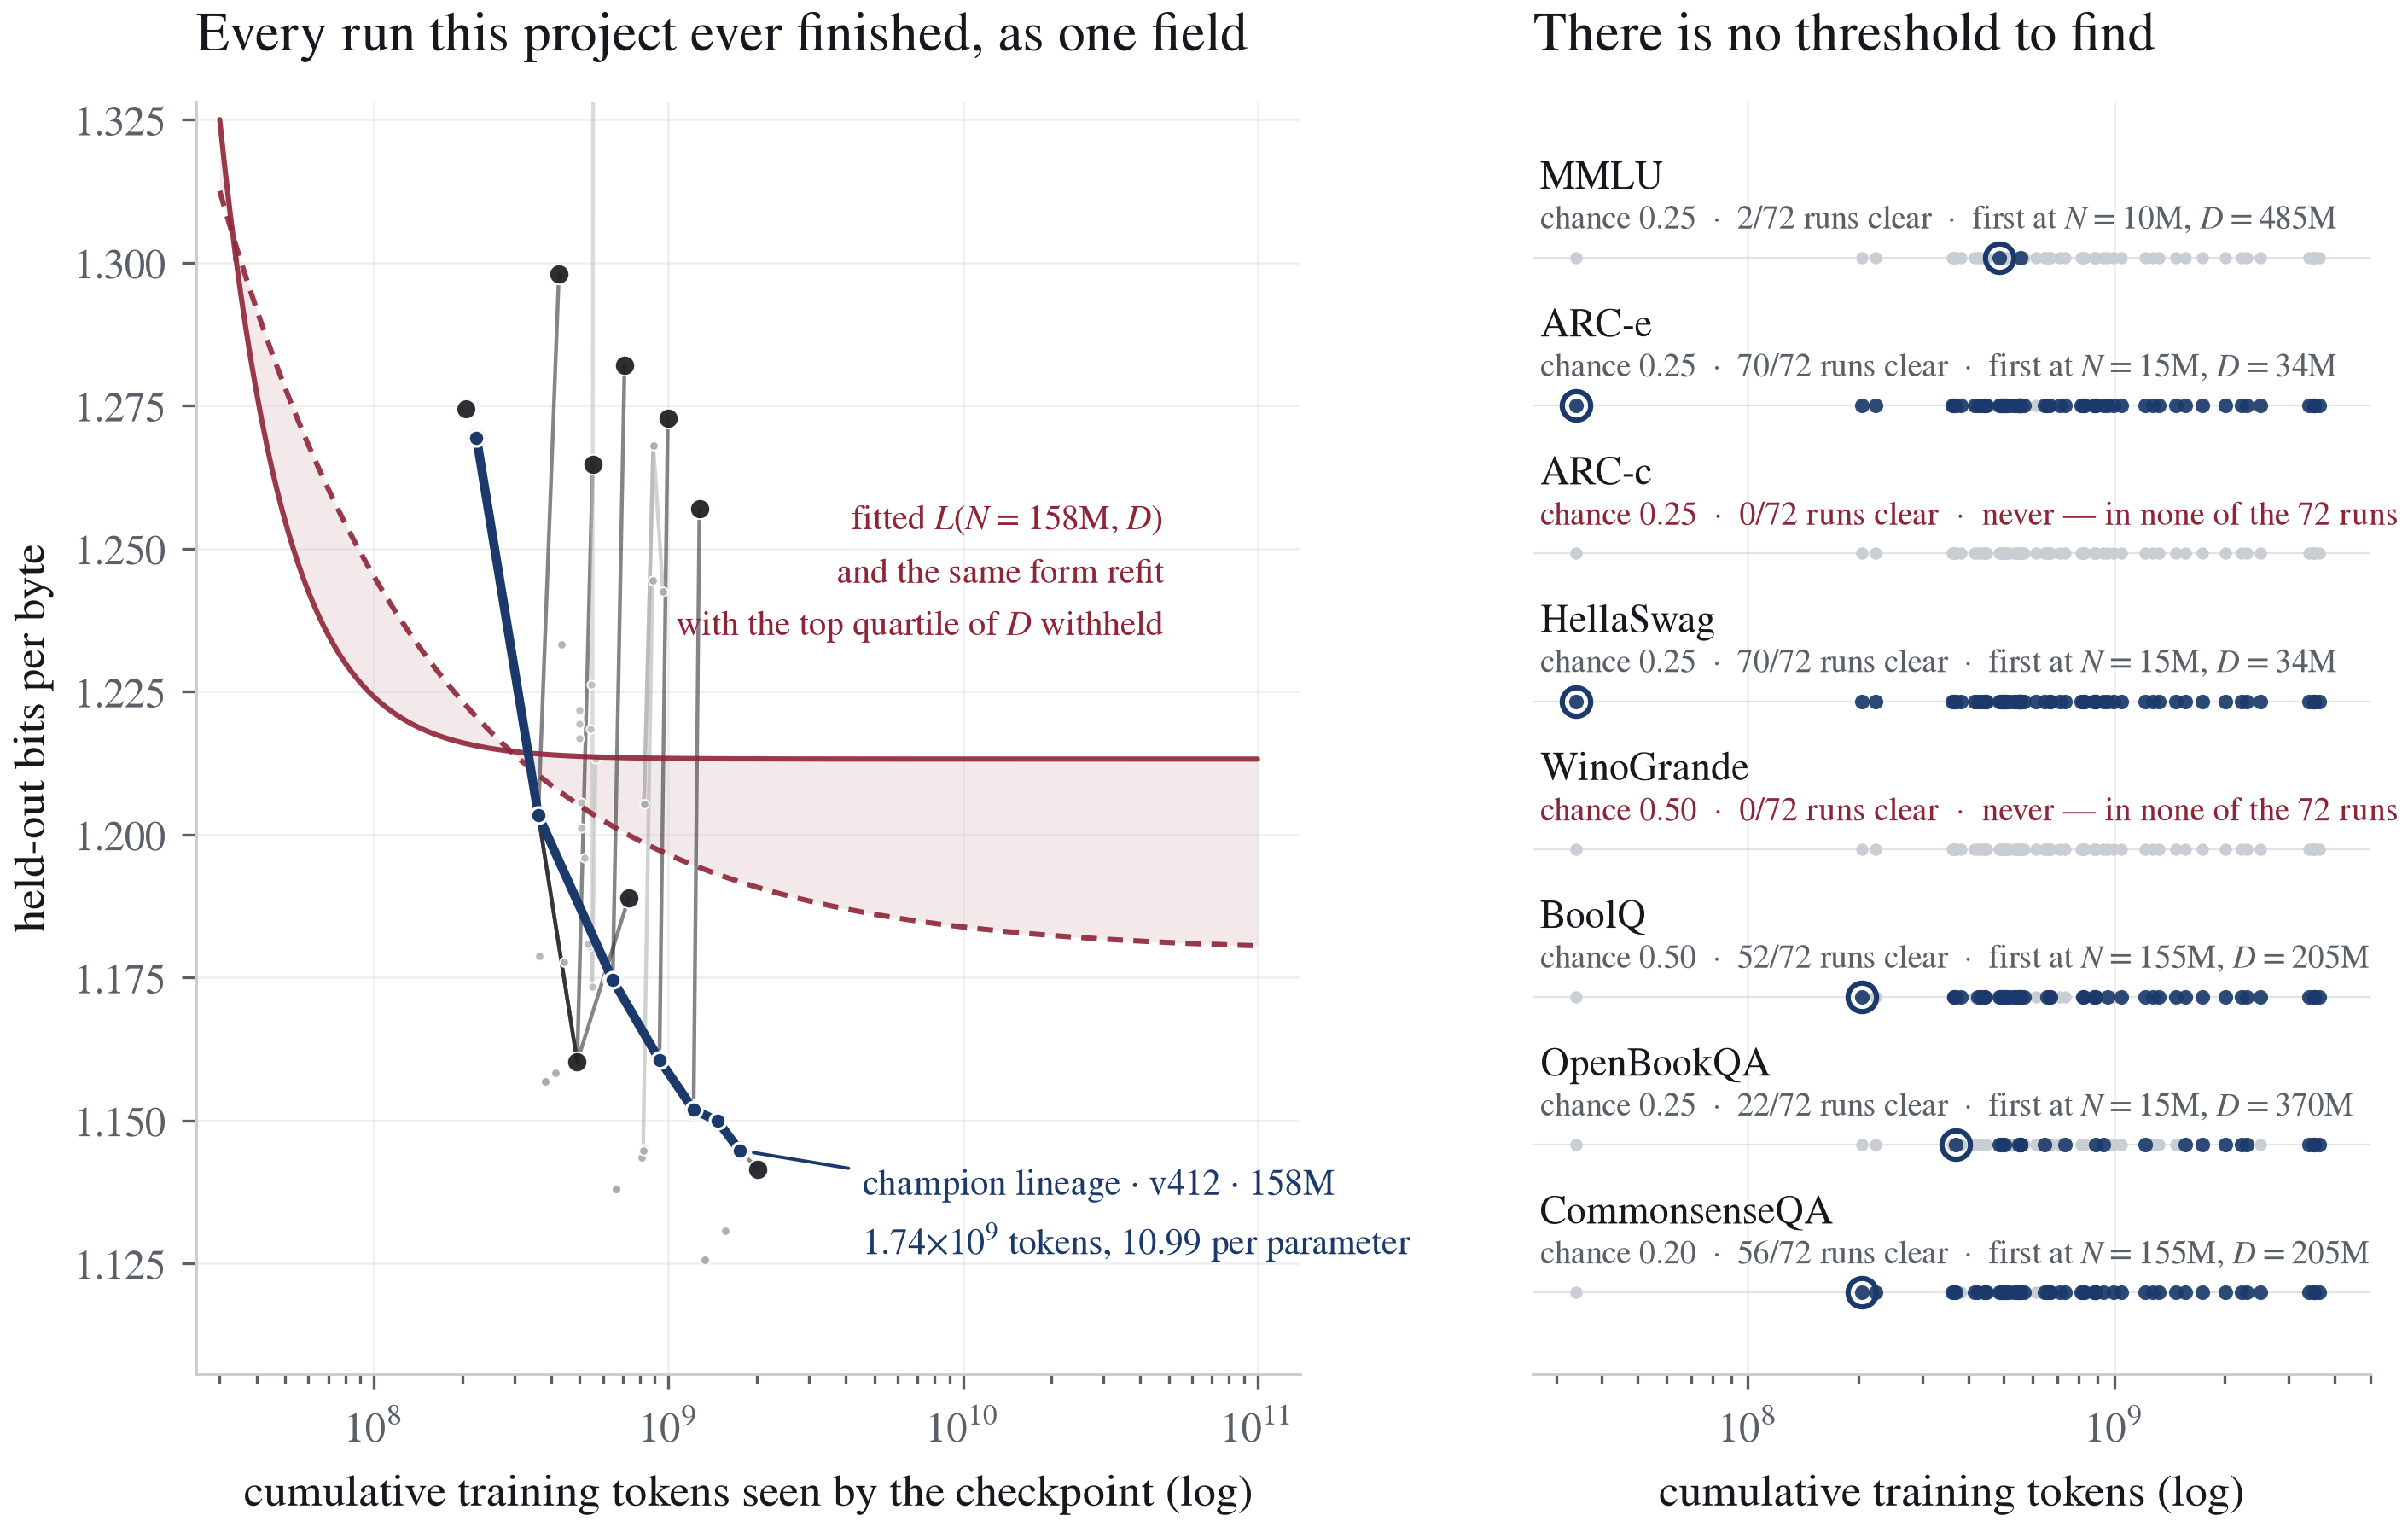
- Across 72 resolvable runs (of 76 trained) over a 15x parameter range, no per-task emergence threshold appears: every task either clears from the smallest model or never clears.
The Question
A laboratory with two GPUs and no cloud budget takes a widely reported 135-million-parameter reference model and asks what separates it from their own, slightly larger 158.6M model. The uncomfortable starting fact is that the bigger model scores lower on the lab's own harness, which invites the reading that the difference is one of recipe and skill rather than raw scale.
That interpretation collapses once you look at the denominator. The reference was trained on roughly 2x10^12 tokens against the lab's 1.97x10^9 - a factor of about 1017 more data, at ~15,000 tokens per parameter versus the lab's 12.4. A smaller model trained on a thousand times more data outperforming yours is, first, a statement about scale.
The paper's premise is that the instrument doing the measuring was itself faulty, in ways the lab could uncover without burning another GPU-hour, and that repairing it flipped the verdict. Every figure in the work is produced by a committed analysis script running on committed data, and can be regenerated on a machine that has no GPU at all.
Fixing The Ruler
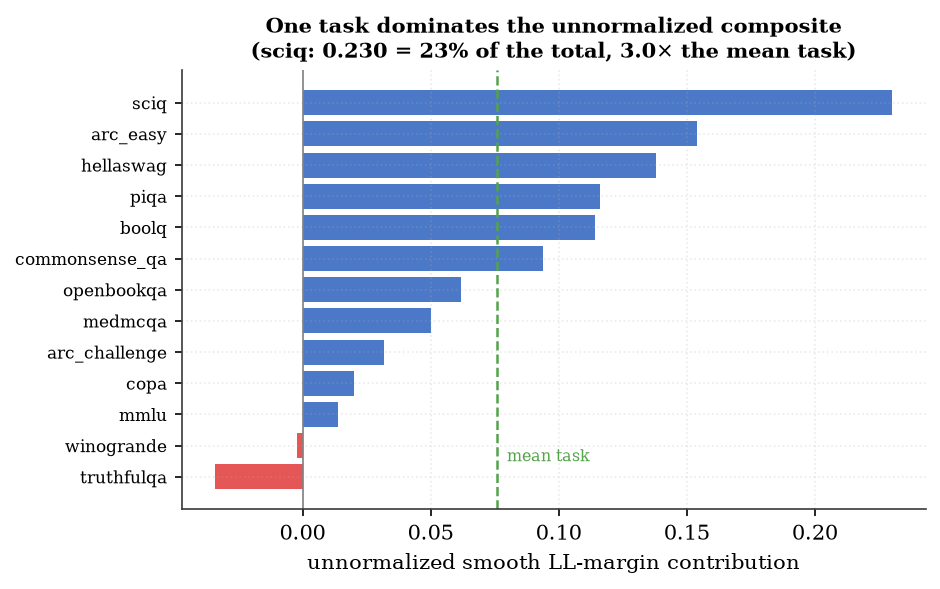
Three defects lived in the instrument, not the model. First, the headline composite averages unnormalized per-task margins, so one intrinsically wide task dominates: SciQ alone contributes 0.230 of a 0.988 total, 23% from one of thirteen tasks. Second, BoolQ, a yes/no task scored on single-token likelihoods, is a class-prior coin flip; its accuracy over 76 runs has median 0.614 with 79% of runs above chance and standard deviation 0.089 versus 0.047 for a genuine four-way task.
Third, and most consequential, the two scoring paths did not compute the same quantity: the lab's own checkpoints were tokenized one way, the reference another that quietly discarded an answer token, and both normalized by token count across incomparable 16k and 49k vocabularies. The fix was a single shared function - one joint tokenization, an answer boundary recovered by matching the longest common prefix, and division by the answer's byte length, a quantity that does not depend on the tokenizer.
This matters because the same fixed SmolLM2 weights swing 0.050 in mean accuracy between the pre-fix and post-fix scorer, and individual checkpoints move by up to 0.118 on a single task - every one of these larger than the 0.028 gap being reported. Any benchmark figure is jointly a property of the model measured and the ruler used to measure it.
The Real Gap
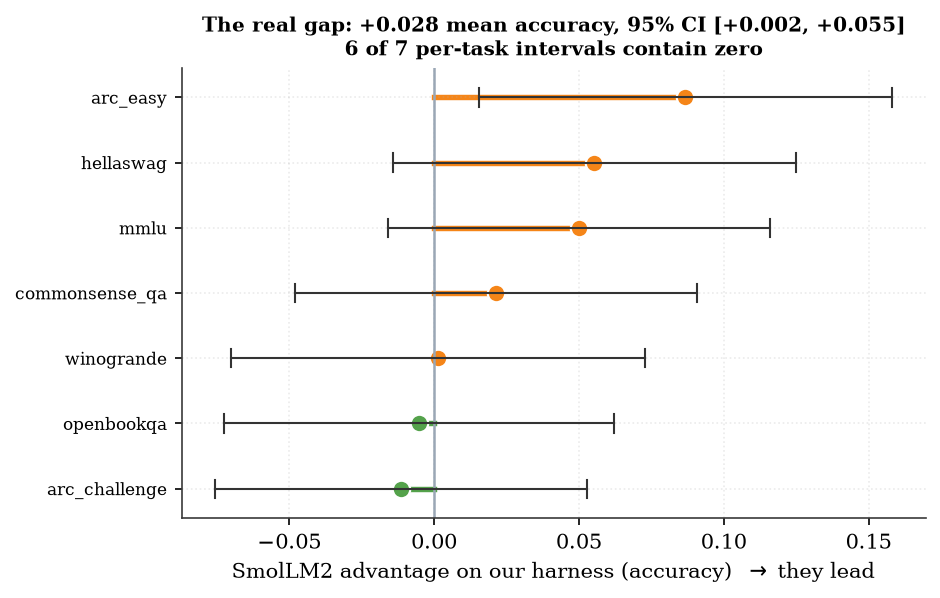
On the rebuilt byte-normalized harness the picture is precise and split. Over the seven tasks surviving BoolQ deletion, the reference leads mean argmax accuracy 0.405 to 0.377 - a gap of 0.028 with 95% CI [+0.002,+0.055] and p=0.035. Yet on the continuous byte-normalized log-likelihood margin over those same seven tasks, the lab's own model leads, +0.188 to +0.141.
The lead is thinner than a tally suggests. The reference wins five of seven tasks, but the sign test gives p=0.45, and with per-task confidence intervals exactly one difference - ARC-Easy, +0.087 [+0.015,+0.158] - excludes zero. On three tasks at least one model is statistically indistinguishable from chance. Quote the raw win count without the intervals and a coin-flip margin masquerades as a clean sweep.
The comparison carries two honest caveats: it is unpaired (n=300 for the lab, n=500 for the reference) and precision-mismatched (float32 versus bfloat16). Outside multiple-choice ranking the lab's models score zero: no trained model tops 0.083 on GSM8K (the maximum value observed is 0.0833) or exceeds 0.02 on MBPP, and none has ever solved a single HumanEval problem.
The Learning Rate Mirage
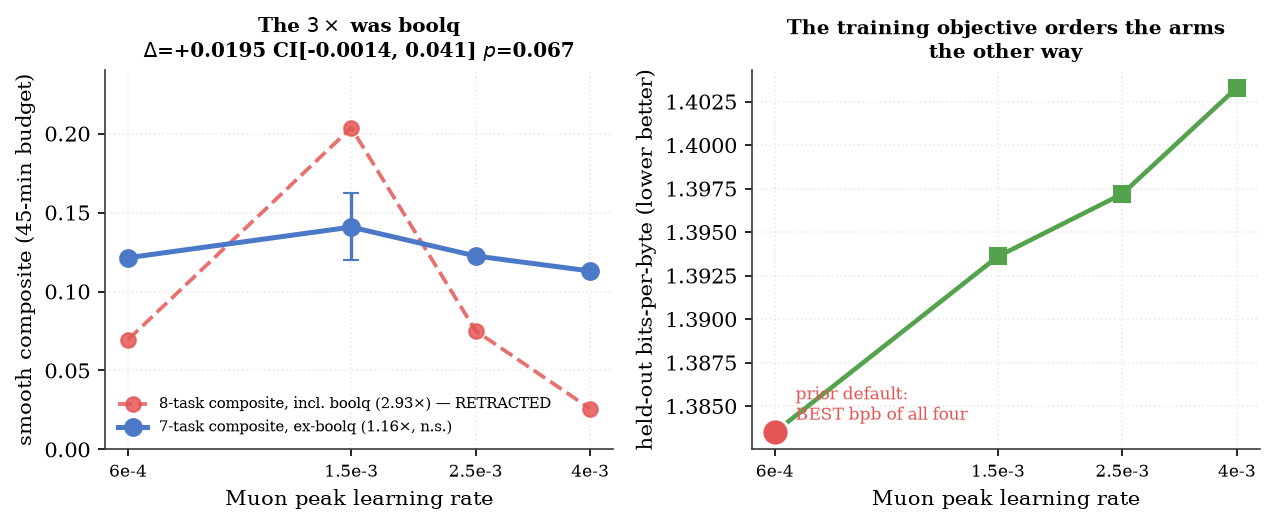
The peak learning rate looked like the most valuable knob on the rig: a sweep described a clean inverted-U with the historical default at 6x10^-4 landing below an apparent optimum near 1.5x10^-3, an apparent 3.0x improvement (0.204 versus 0.069 on the eight-task composite). A threefold return on one hyperparameter would license re-running every prior data-intervention verdict.
It does not survive its own arithmetic. The eight-task composite includes BoolQ, and recomputing from the sweep's own per-example margins with BoolQ deleted collapses the factor to 1.16x (delta +0.0195, 95% CI [-0.0014,+0.0410], p=0.067) - the interval contains zero. A leave-one-task-out sweep confirms this is BoolQ specifically: deleting any other single task leaves the effect between +0.1465 and +0.1535 at p<0.001. At the level of examples, BoolQ's mean margin translates by +0.9375 between arms while the second-largest movement elsewhere is +0.0481, a factor of 19 smaller.
The training objective disagrees outright: held-out bits-per-byte is best at the old 6x10^-4 default (1.3835 versus 1.3936 at the apparent optimum), and seven-task accuracy is flat with the default nominally highest. The obvious alternative mechanism - that BoolQ's two-byte 'yes'/'no' answers put it on a wider scale - was tested and refuted: BoolQ's margin spread ranks fourth of eight, near the median. What makes BoolQ decisive is not that its scale is wide but that its distribution shifts.
Buy Off The Shelf, Don't Build
The lab was preparing to generate its missing knowledge-and-reasoning data by distilling from a local teacher. Two independent adversarial audits reached the same objection: a moderate teacher emits about a million tokens per hour, so the tens of billions of tokens needed would cost years of compute, and a weak generator produces weak data. The corpus actually needed - curated synthetic textbooks, mathematics, and filtered web text - was the reference model's own openly published training mixture, re-tokenizable to the lab's vocabulary at the cost of a day.
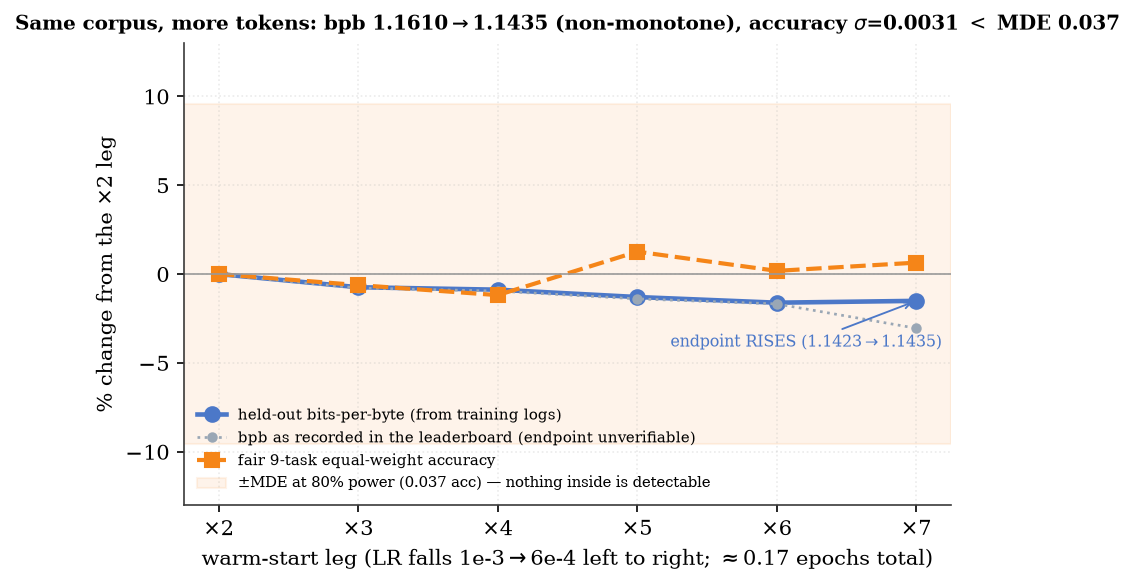
The transferable rule cost no compute to reach: at small-model scale, look for an existing published corpus before committing a budget to build one yourself. A token-scaling series over the lab's own narrow corpus reinforced the point - adding 1.6 billion fresh tokens improved compression (bits-per-byte from 1.1610 to 1.1435, about 1.5%) while accuracy did not move, holding at 0.388. Crucially the series consumed only 0.17 epochs of a 9.14x10^9-token corpus, so no token was ever repeated; and its minimum detectable effect (0.037) exceeds the whole gap to the reference, so this is an absence of detection, not a demonstrated null.
Where Contamination Hides
The sharpest result inverts intuition. Using an evaluation-side hashed index (about 1 CPU-hour per 10^10 tokens) validated to 64/64 positives and 0/64 negatives, the lab scanned its own corpora and four components of the reference's published mixture. At a matched budget every web corpus is essentially clean, but the small buffer hand-assembled for quality - injected over the final 40% of every training leg - carries verbatim 13-grams of 17 of 4000 evaluation items, against 0 or 1 for every web or reference corpus.
The mechanism generalizes: a quality filter tends to pull in text shaped like the benchmarks, a mixture is only as clean as its least-decontaminated source (15 of the 17 leaks entered through an unfiltered multiple-choice pool), and the leakage bites hardest at the annealed tail of training. Scanned to completion, the reference's own FineMath corpus reaches 5.0% on BoolQ and 2.8% on MMLU - exactly the pre-registered trigger level at which a decontamination statement belongs in every small-model report.
Two supporting measurements close the arc. Mining the 76-run ledger, a fitted L(N,D) scaling law misses its own pre-registered 2% held-out bar (4.5% leave-one-out, 5.8% extrapolated), so the paper publishes the forecast error rather than a forecast. And over a fifteenfold parameter range, no per-task emergence threshold appears at all: ARC-Easy and HellaSwag clear from the smallest 15.4M run, ARC-Challenge and Winogrande are cleared by no run, and MMLU's only two successes come from the two smallest models trained.
Abstract
This work is a measurement-driven account of training a small language model toward the quality of the small-frontier on a fixed pair of GPUs, with no recourse to rented compute. Its contribution is a method and its results: adversarial self-audit of a laboratory's own instrument, which here recovered more capability-relevant signal than additional training would have. We establish that a composite averaging unnormalized per-task margins is dominated by a single high-variance task; that scoring the reference through our own harness exposed a scorer computing a different quantity for the two models; and we rebuilt it around a single byte-normalized, joint-tokenization scorer. On that instrument the picture is precise and split. We further add the first benchmark-contamination measurement of its kind, with a detector validated against positive and negative controls built from the corpora themselves (64/64 and 0/64).
More figures
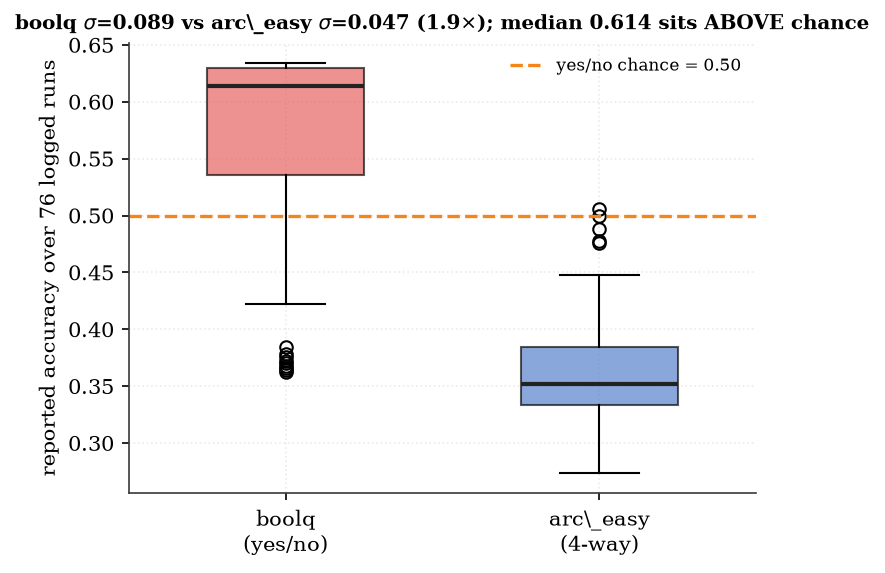
Fig. 1BoolQ accuracy over 76 runs is 1.9x as variable as ARC-Easy and sits above the yes/no chance line (median 0.614), the signature of a majority-class prior. 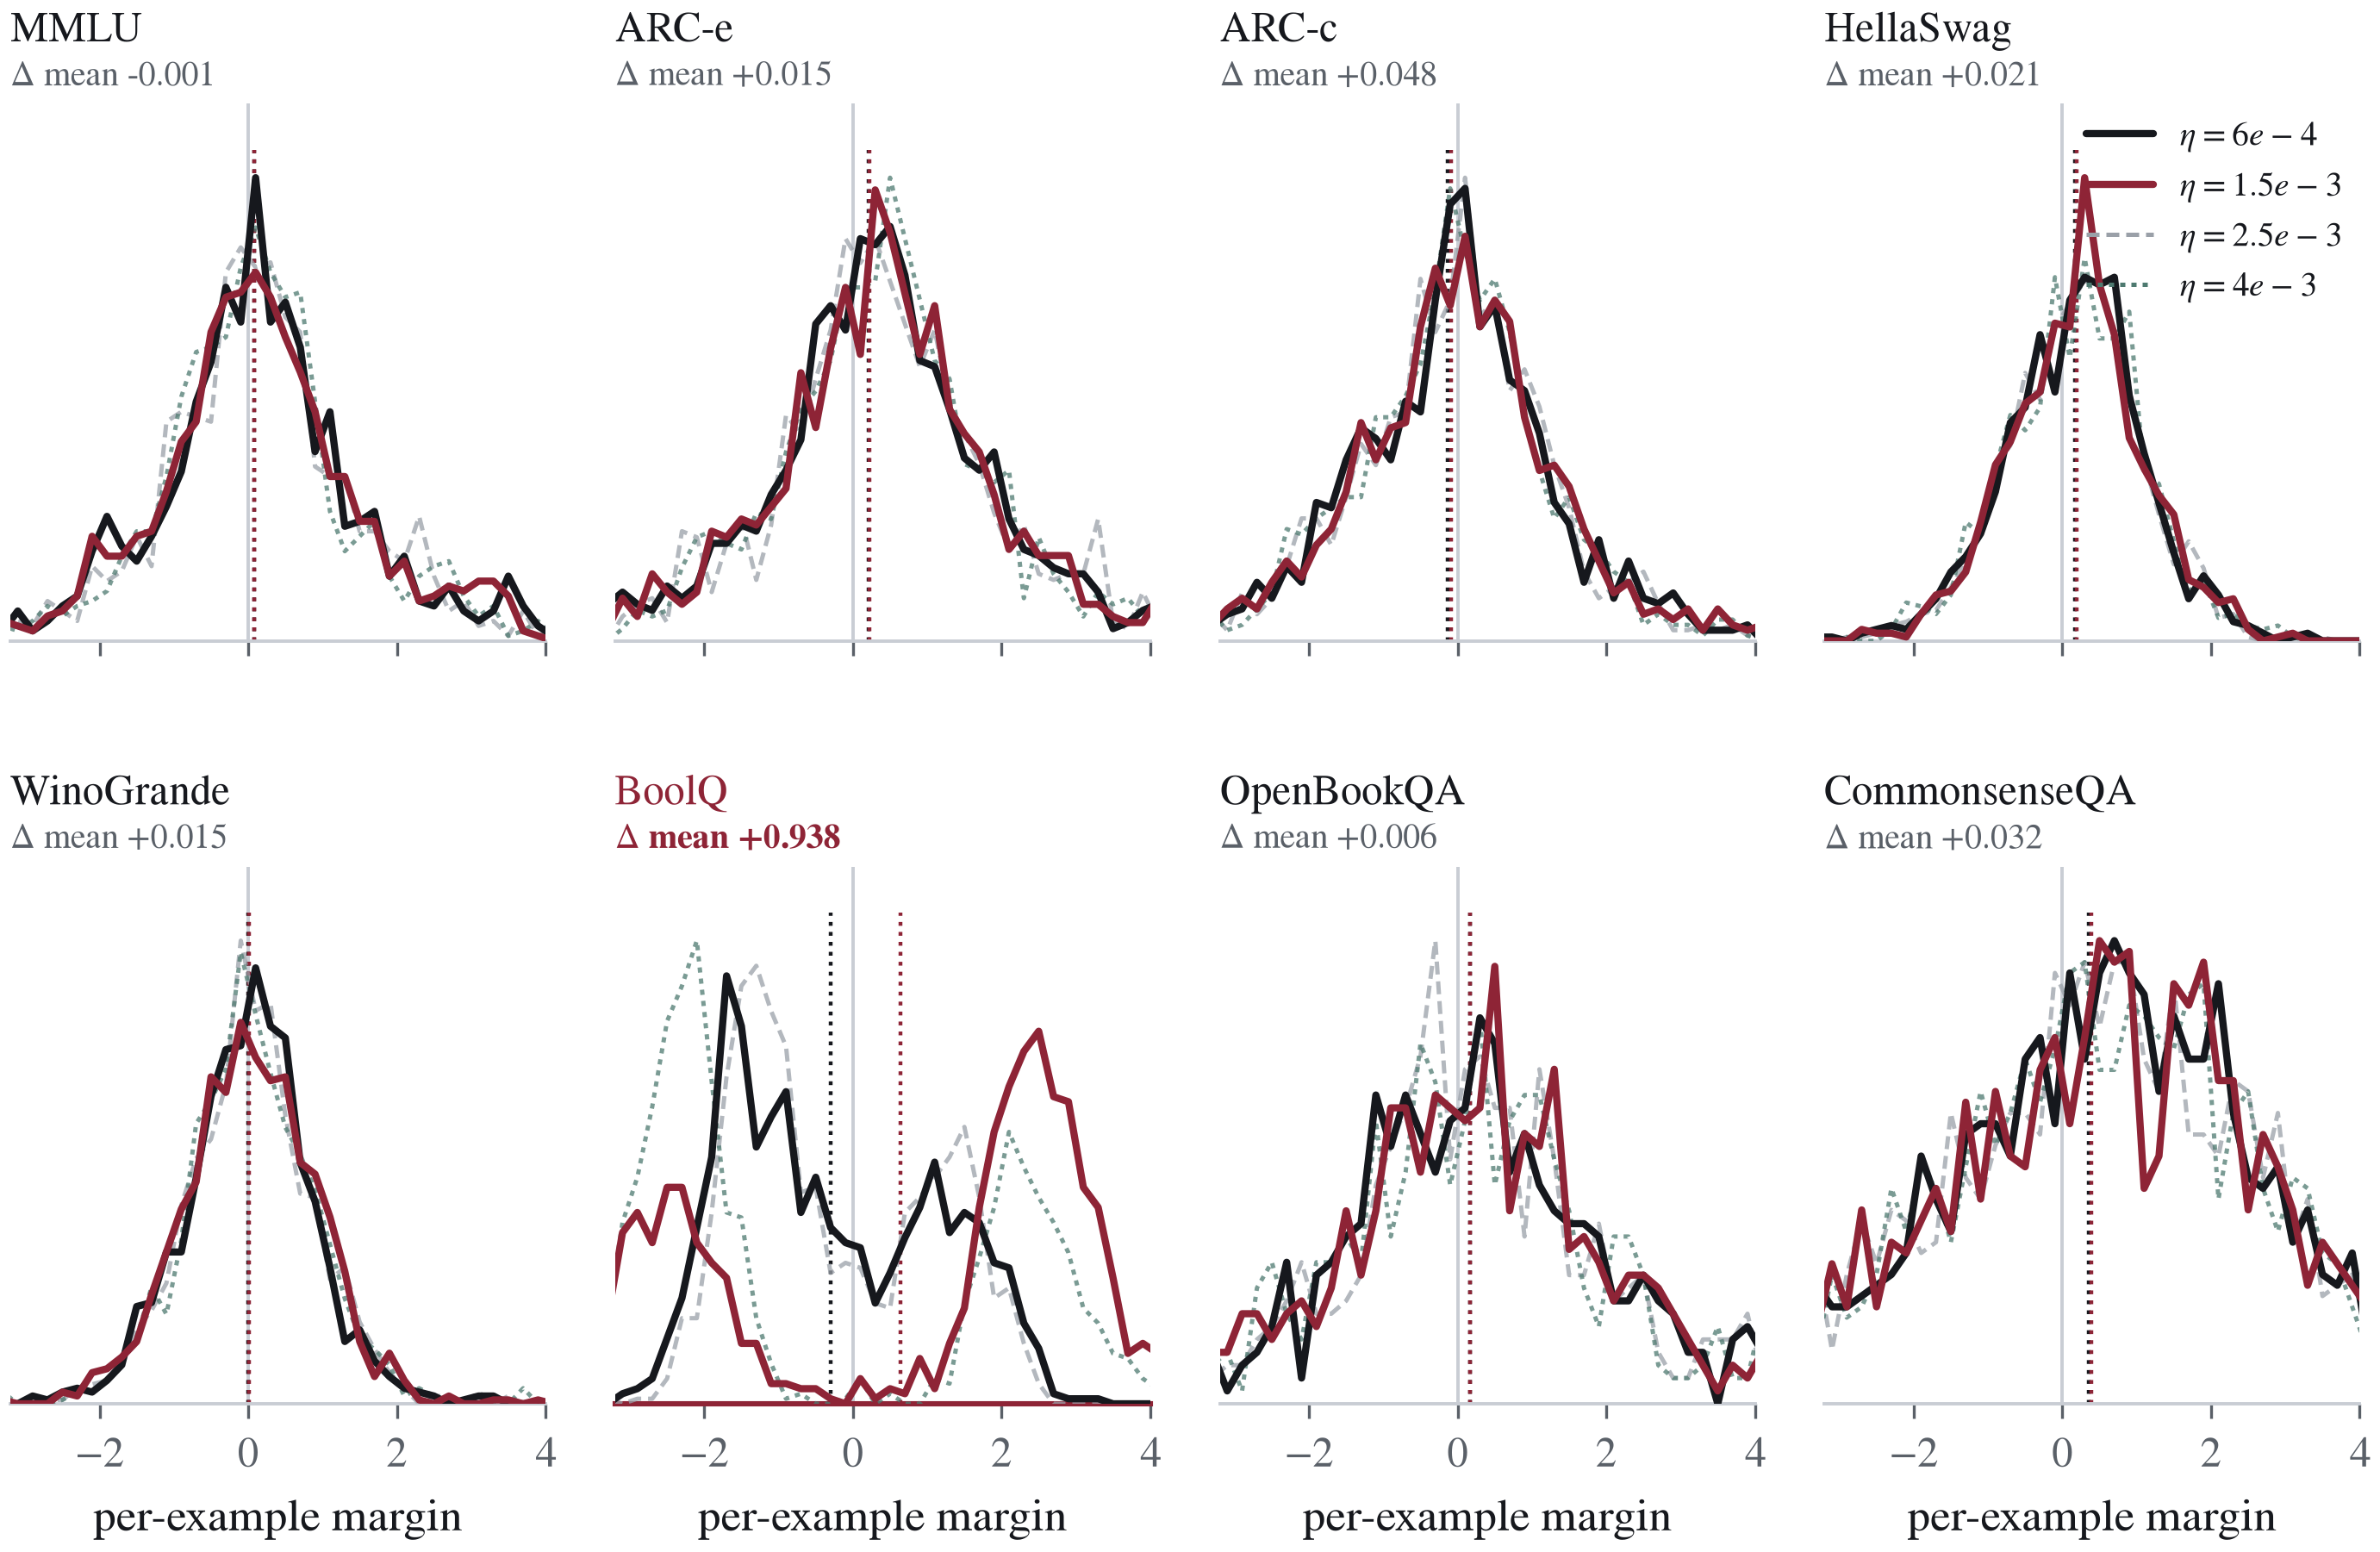
Fig. 2Per-example margin distributions for all four learning-rate arms: only BoolQ translates (by +0.9375), while the other seven tasks are indistinguishable between arms. 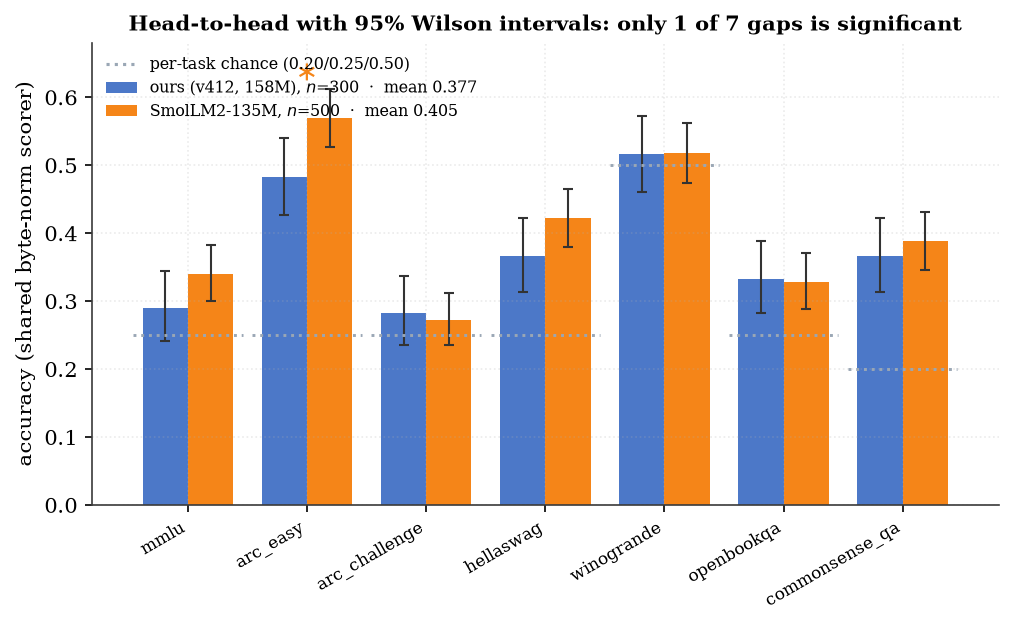
Fig. 3Head-to-head on the fixed byte-normalized harness with 95% Wilson intervals and per-task chance lines; the reference leads five of seven, only ARC-Easy significantly.