
Moneyball with a Research Program
Sixteen sports, two tables, one honest verdict — you can beat the baseline everywhere and still lose to the closing line.
In brief
A disciplined, honesty-first attempt to convert sports modeling into prediction-market edge across sixteen sports. Its most valuable output is a negative result stated without hedging: calibrated models beat every naive baseline and still cannot beat the liquid closing line, which is exactly what an efficient market should do. The project is engineered so that this uncomfortable conclusion is measured rather than papered over, and it relocates the search for edge from forecasting the world to modeling the market's machinery.
Key results
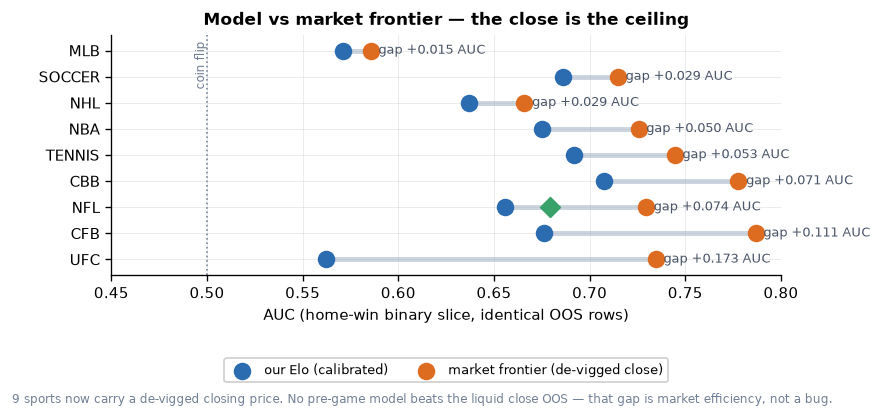
- A leak-free Elo on a 14,000-match, six-league soccer backbone posts a Brier score of 0.241 while the de-vigged market close scores 0.212 — the model beats a coin flip but loses to the price.
- The de-vigged closing line is near-perfectly calibrated on that soccer set: an actual home-win rate of 0.43 against a mean market-implied probability of 0.428.
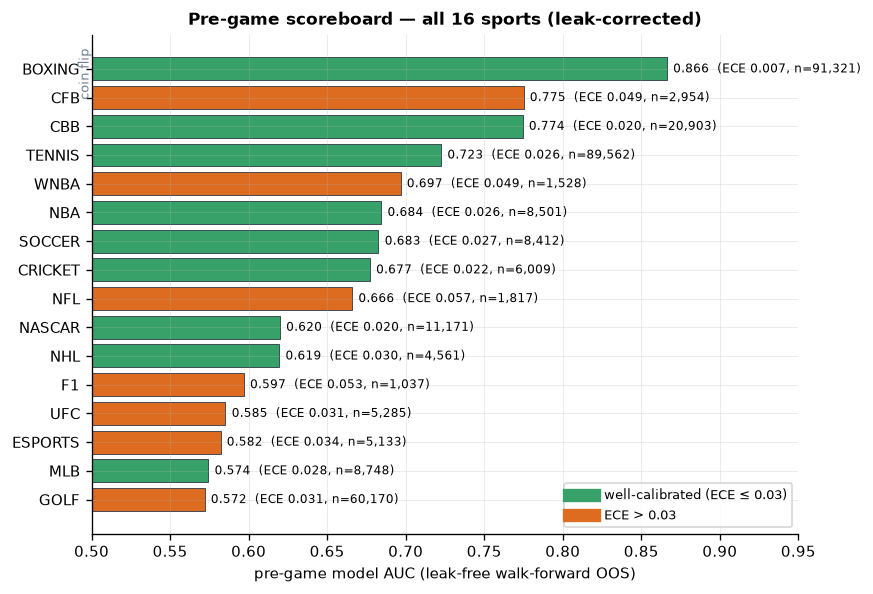
- Two apparent triumphs were leakage: golf's 0.982 and tennis's 0.876 AUC collapse to audited leak-free values of 0.572 and 0.723 once bet-time information hygiene is enforced.
- Every trained model calibrates to an expected calibration error below 0.07, making probabilities — not picks — the product the rest of the system consumes.
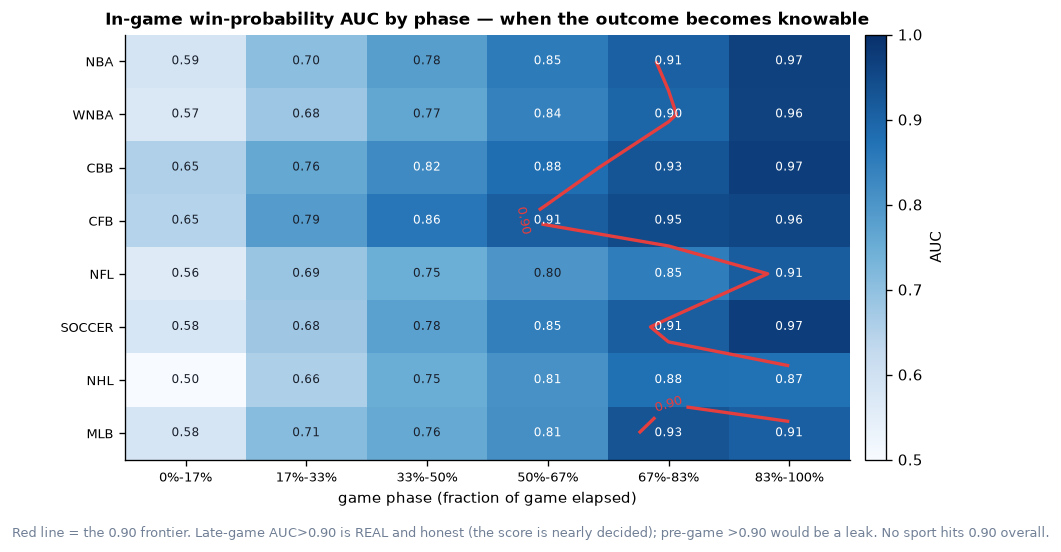
- 90%-plus accuracy is real only on the confident tier or late in a game; pre-game across all games it is a leakage artifact, not an edge.
- The roughly hundred candidate signal families are governed by a correlation trap — rating-keyed families share about ρ̄≈0.5, so N=8 nominal signals collapse to N_eff≈1.8 effective ones.
The Question, Per Sport
Most sports-modeling efforts build a single predictor and expect it to be profitable. This program refuses that framing. It asks, for each of sixteen sports traded on Kalshi and Polymarket, a prior question: how learnable is this outcome at all? A single MLB game sits closer to a coin flip than a single NBA game, and no amount of feature engineering repeals that. So the first deliverable for every sport is not a model but a measurement of its irreducible noise floor and its ceiling.
The stated edge, if it exists, comes from one of three places: better priors (ratings that misprice less than a narrative-driven crowd), faster or richer information (injuries, lineups, weather, line movement, in-game state), or structural and behavioral inefficiencies (thin liquidity, favorite bias, cross-venue mispricing). Crucially, the program is explicit about what it is not doing — it is not copying whale flow or scalping manipulated short-horizon crypto markets, both of which it had tried before and judged fragile and gameable.
Two Tables For Everything
The engineering premise is that heterogeneous sports data — play-by-play, box scores, 1v1 match logs, race results — can be reduced to two tables with identical columns for every sport. GAMES holds one row per contest: the two sides, scores, winner, season, point-in-time ratings, and the de-vigged market closing probability that serves as the benchmark. MARKETS holds one row per price observation, joinable back to GAMES for Closing-Line-Value analysis.
The payoff of this discipline is that the market mathematics — de-vigging, expected value, Kelly sizing, log-loss, Brier, expected calibration error, and CLV — is written exactly once and works across every sport, as is a generic leak-free, point-in-time Elo that gives each sport a baseline to beat. Schema is enforced rather than assumed, and each sport has a runnable ingestion pipeline that materializes a compact parquet backbone and registers it in a self-documenting manifest.
A Layered Modeling Stack
Above the backbone sits not a single tabular model but a stack. The team view runs leak-free Elo into a calibrated gradient-boosted tree, validated walk-forward. A player view composes per-player ratings, minutes-weighted, into team strength — the documentation notes NBA beats team-only on all metrics and that MLB starting-pitcher information adds signal. In-game, trained state-to-win-probability models replace a weaker diffusion approximation and are checked against real minute-by-minute replay.
The philosophy is consistent throughout: the deliverable is a calibrated probability rather than a pick, so the system optimizes probabilistic loss and treats a near-diagonal reliability curve as a gate a model must pass before it is allowed to trade. The market is treated as a strong teammate rather than an adversary — a per-sport blend weights model against market rather than pretending the model can simply overrule a liquid close.
The Honest Verdict
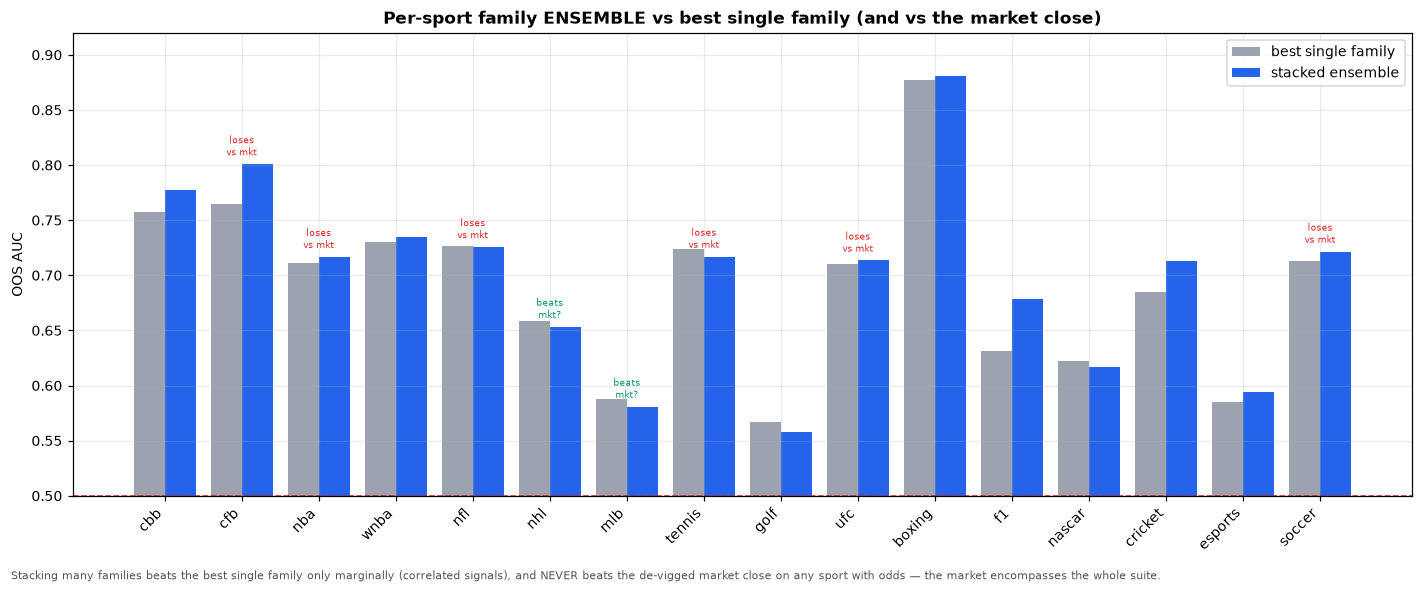
The headline is delivered without softening: the calibrated models clear every naive baseline, yet none of them out-scores the liquid close, and that residual is the market being efficient. The soccer backbone makes the point concretely and reproducibly. On 14,000 matches across six European leagues, the de-vigged closing line is near-perfectly calibrated — an actual home-win rate of 0.43 against a mean implied probability of 0.428 — and a naive leak-free Elo does not beat it, posting a Brier of 0.241 against the market's 0.212.
The program is equally candid about its own near-misses. Two eye-catching AUCs, golf at 0.982 and tennis at 0.876, turned out to be leakage; under audit they fall to leak-free values of 0.572 and 0.723. The general rule the project extracts is that 90%-plus accuracy is real only on a confident subset or late within a game, and never pre-game across all games.
Learnable Versus Coin Flip
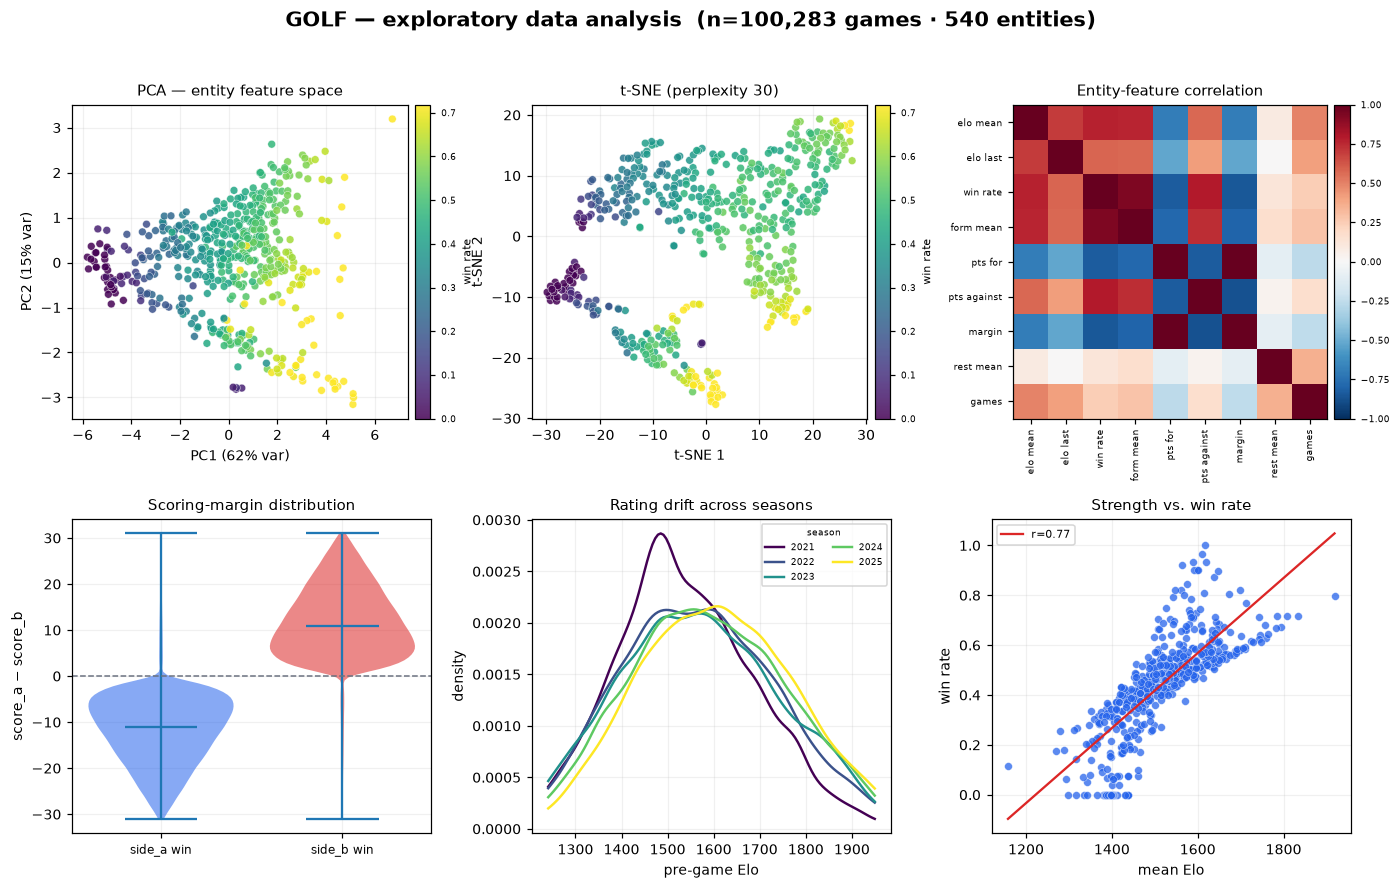
Before any model is written, every sport receives a six-panel exploratory analysis that reduces the backbone to an entity table — one row per team or player with Elo, win rate, form, margins, and home/away splits — and probes its structure with PCA and t-SNE, correlation heatmaps, margin and Elo violins, rating drift, and, where odds exist, a de-vigged closing-line density.
The visual grammar is deliberately simple. A sport with a smooth win-rate gradient and a wide Elo spread — golf, tennis — shows an elite ridge that a rating model can exploit. A sport that collapses to a single tight blob with no gradient — MLB, UFC, both near the coin-flip AUC floor — announces that its ceiling is low by nature. Establishing that ceiling first is itself a finding, because it tells the program not to mistake variance for edge in a high-noise sport.
Where The Edge Actually Lives
Having shown that the world is priced efficiently, the program relocates the search. A forecasting edge must be right about the world; a market-structure edge only needs to be right about the plumbing — which desk is quoting, which side the crowd piles onto, which venue moves first, how quickly injury news propagates, how a resolution source settles a contract. The historical-close data that repeatedly killed forecasting edges structurally cannot contain order flow, cross-venue quotes, or in-play tape, so it could never disprove the structural families.
This frames roughly a hundred candidate signal families — designed by adversarially collaborating quant agents and red-teamed — as live hypotheses rather than truths. The caveats are stated as sharply as the thesis: diversification reduces variance, not edge, and is useless if each edge is near zero on a liquid venue; rating-keyed families are one view measured many ways, so eight nominal signals at ρ̄≈0.5 collapse to N_eff≈1.8; and a hundred families is a data-snooping machine that demands false-discovery control and forward-CLV as the un-foolable arbiter. The honest expected outcome is a modest market-making book plus a few un-provable niches — and capital allocation to any forecasting family stays at zero until it clears live CLV.
Abstract
sports-ai is a research program that treats each of sixteen sports traded on Kalshi and Polymarket as its own scientific question: how learnable is the outcome, where does signal live, what is the irreducible noise floor, and whether any modeling advantage still holds once the market price is in the room. Heterogeneous inputs — play-by-play, box scores, one-versus-one match logs, race results — are reduced to two canonical tables with identical columns for every sport (GAMES, one row per contest with point-in-time ratings and the de-vigged closing probability; MARKETS, one row per price observation), so ratings, de-vigging, Kelly staking, Closing-Line-Value analysis, and walk-forward backtesting are each written once and reused everywhere. On top of the backbone sits a layered stack: a generic leak-free Elo baseline, calibrated gradient-boosted trees, minutes-weighted player ratings, trained in-game state-to-win-probability models validated by minute-by-minute replay, and a per-sport market blend. The central finding is stated plainly and repeatedly: calibrated models clear every naive baseline, yet none of them out-scores the liquid close, and that residual is exactly the market being efficient. Every model calibrates to an expected calibration error below 0.07, yet a leak-free Elo on 14,000 soccer matches posts a Brier score of 0.241 against the near-perfectly calibrated market's 0.212. Two headline AUCs — golf at 0.982 and tennis at 0.876 — are shown to be leakage and are re-reported at their audited leak-free values of 0.572 and 0.723. The program concludes that the frontier is not out-predicting outcomes but market structure — the plumbing of which desk is quoting, which side the crowd piles onto, which venue moves first, and how contracts resolve — and it treats every one of roughly a hundred candidate signal families as a live hypothesis whose capital allocation stays at zero until it clears forward Closing-Line-Value.
More figures
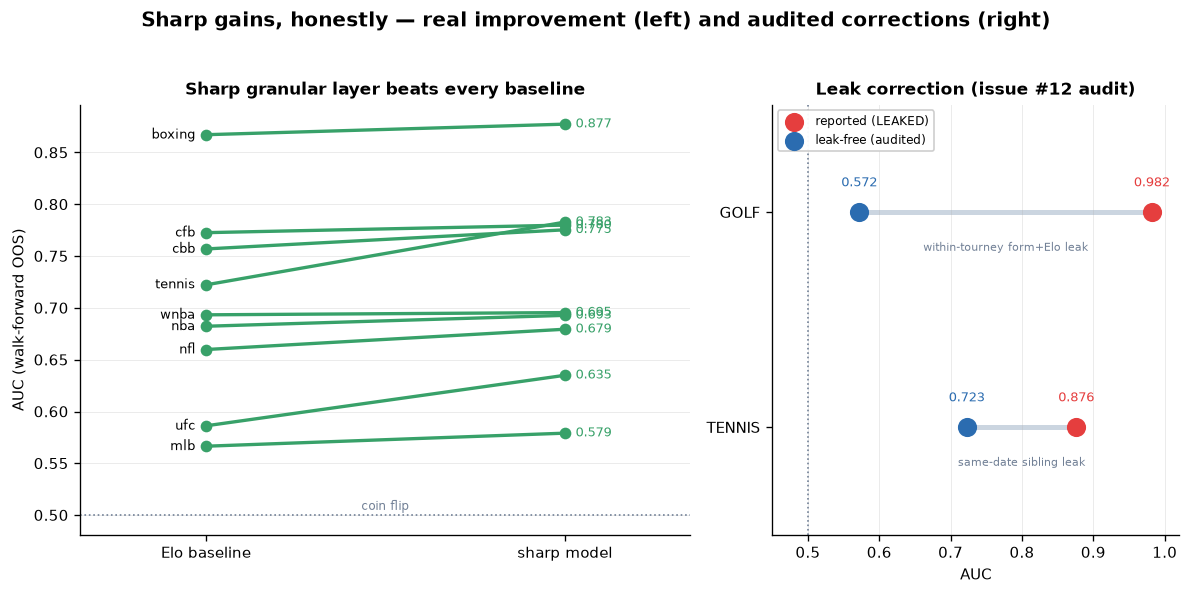
Fig. 1Sharp gains reported honestly: the real lift a model provides shown alongside the audited leakage corrections that inflated the raw numbers. 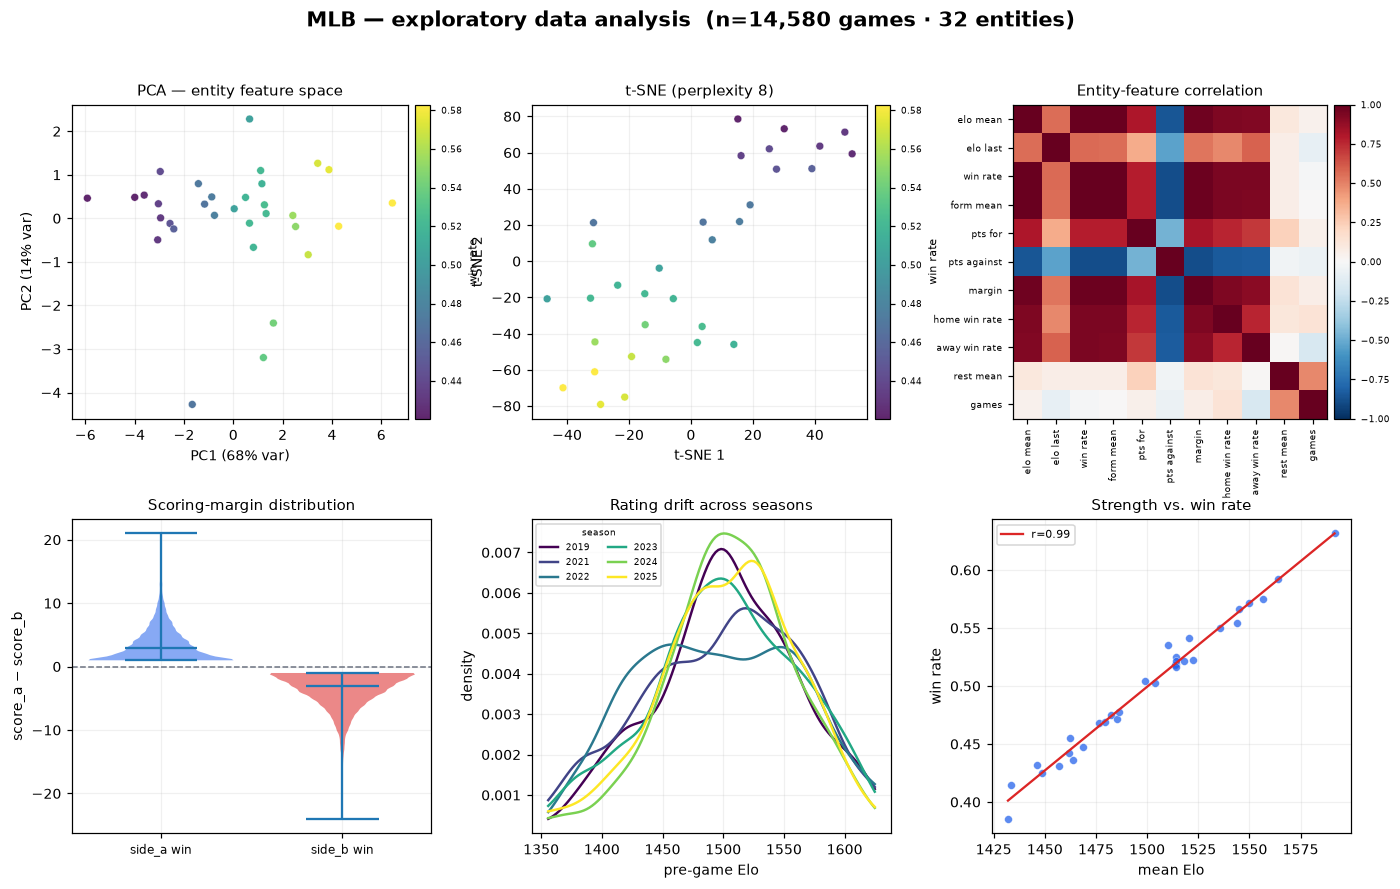
Fig. 2MLB's entity cloud collapses to a single parity blob with no win-rate gradient — the visual signature of a coin-flip noise floor near AUC 0.58.